Repolarization
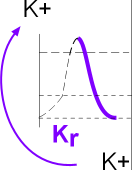 The section of the diagram to the left shows that repolarization is due to potassium efflux through rapid delayed rectifier channels (Kr). This initial potassium current is small;
it coexists with a small but declining calcium current described in the previous tutorial.
When the membrane potential becomes negative, the potassium current exhibits a significant increase ... the calcium current having
ended ... and the membrane potential decreases rapidly.
The section of the diagram to the left shows that repolarization is due to potassium efflux through rapid delayed rectifier channels (Kr). This initial potassium current is small;
it coexists with a small but declining calcium current described in the previous tutorial.
When the membrane potential becomes negative, the potassium current exhibits a significant increase ... the calcium current having
ended ... and the membrane potential decreases rapidly.
Rapid Delayed Rectifier Potassium Channels, Kr
The structure of these channels is still a topic of intense investigation.
The following descriptions of the various states of these channels are intended to provide a
framework to help understand how they function.
The following requires prior knowledge of information presented in
Channels and Currents tutorial .
Channel Configurations
This channel consists of four separate proteins; the cytoplasmic N (purple) and C (peach) terminals comprise ~80% of each protein ... though this
is not the impression given in the following illustrations. The four
proteins are arranged in a circle leaving a pore between them. The following series of illustrations show two of the four
proteins on either side of the pore.
Activated
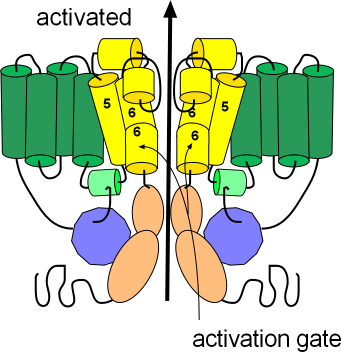 The first illustration shows the channel in its open or activated state as indicated by the black arrow. The sensor domain, S1-S4, is shown in green while
the pore domain, S5-S6, is shown in yellow. The S6 helices, lining the pore, are hinged and their cytoplasmic ends are bent downward so as
not to occlude the pore. These hinged regions form the activation gate.
The first illustration shows the channel in its open or activated state as indicated by the black arrow. The sensor domain, S1-S4, is shown in green while
the pore domain, S5-S6, is shown in yellow. The S6 helices, lining the pore, are hinged and their cytoplasmic ends are bent downward so as
not to occlude the pore. These hinged regions form the activation gate.
The ends of each protein extend into the cytoplasm; the N terminus is from the S1 helix while the C terminus is
from S6; notice portions of these terminals are attached to each other (purple/peach). The C-terminal has two coiled sections (peach)
with a long flexible extension after that. The N-terminal consists of a relatively long flexible section with a
coiled section (purple) near the end. A short extension follows the coil and is referred to as a 'tail'.
With the channel in the open position this tail attaches to a small helix (light green); this attachment might
help stabilize the open conformation.
There are short segments that run between the membrane-embedded helices (green and yellow);
two of these 'linkers' have short helices of their own. The helix (light green) of the cytoplasmic S5S6 linker
is where the 'tail' of the N-terminal attaches to help stabilize the open configuration. The outer S5S6 linker
is fairly long and has two helices (yellow). One helix lies at the external surface followed by a fairly long extension
that hangs into the pore itself; this extension folds back upward after forming the second helix. The extension hanging into the
pore forms part of the selectivity filter that permits the passage of only potassium ions.
Deactivated
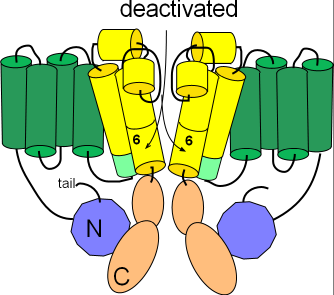
Several changes occur to form the closed or deactivated channel as shown in the second illustration. The pore
closes when the hinged portions of the S6 helices bend toward each other.
Additionally, the helix on the S4S5 linker (light green) is repositioned to align with the cytoplasmic end of S5. Careful inspection shows that the
tail of the N-terminal is no longer in contact with this helix.
Inactivated
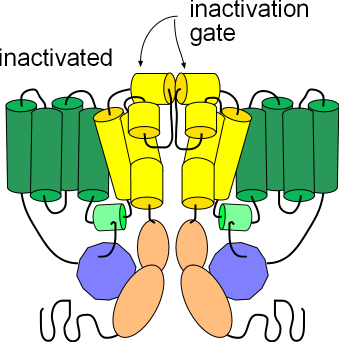
The third illustration shows the channel in the inactivated state. Its conformation is the same as the activated state
but the helices (yellow) at the external membrane surface have moved toward each other obstructing the opening of the pore. These
small helices form the inactivation gate. Note that this conformation, like the deactivated state above, will not allow
the passage of ions; inactivation must be removed in order for ions to pass through.
Potassium Current, IKr
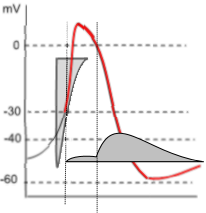 The graph to the left shows both the potassium current icon (darker grey) and the lighter calcium current icon of depolarization.
Unlike the prior calcium current, the potassium current is due to effluxing ions thus the horizontal line of the current icon forms
its lower border. Note that the potassium current begins halfway through depolarization and continues into diastolic depolarization (red curve).
The graph to the left shows both the potassium current icon (darker grey) and the lighter calcium current icon of depolarization.
Unlike the prior calcium current, the potassium current is due to effluxing ions thus the horizontal line of the current icon forms
its lower border. Note that the potassium current begins halfway through depolarization and continues into diastolic depolarization (red curve).
The shape of the potassium current icon (dark grey) indicates that initially (first vertical line) there is only a very small, steady current.
However, when the membrane potential drops back to 0mV (second vertical line) there is a sudden increase in the potassium current that
quickly reaches a maximum then begins a slow decline. This decline extends beyond the end of repolarization and into diastolic depolarization.
This unusual current is due to the gating behavior of these channels.
During depolarization, when the membrane potential reaches ~-30mV , the activation gates open followed
quickly (rapidly: Kr) by the closure of the inactivation gates that block the current.
However, the inactivation gates don't stay closed very well and, about 10% of the time, they
open briefly. It is during these brief, unsynchronized openings that a small current flows. But, when the
membrane potential repolarizes to ~0mV (second vertical line), the inactivation gates begin to 'lock' open leading to
a maximum current. Gradual closure of the activation gates (deactivation) is the cause of the slow decay of the current.
Updated: 2/19/2016
Continue to Early Diastolic Depolarization
Return to previous tutorial... Depolarization
Return to home page