Cardiac Pacemaker Tutorial
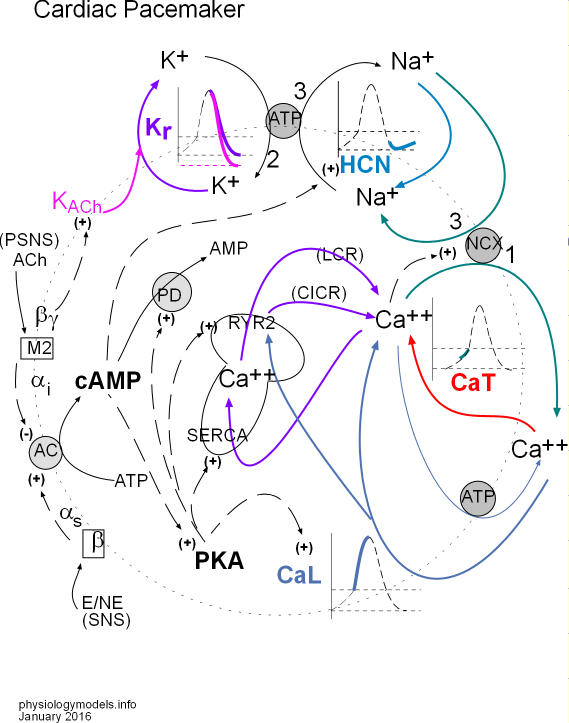
Click on 'Model' in the menu to the left to view this at any time. You can select and print a copy from this page. The model depicts the interrelationships between the major topics of this tutorial.
Click on "Overview" in the Menu to the left.
Double-click the next section in the Menu.
Overview of Cardiac Pacemaker Action Potential
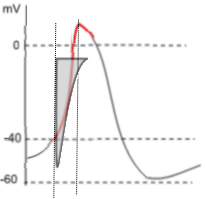
This action potential (AP) graph shows the fluctuations in the membrane potential of the nodal cells of the cardiac pacemaker. These fluctuations occur because of the activities of voltage-gated channels and ion pumps in the cell membrane (called the 'membrane clock') and activities of channels and pumps in the sarcoplasmic reticulum membrane (called the 'calcium clock'). The concept of a calcium clock is fairly new and not included in most textbooks. This tutorial describes these activities.
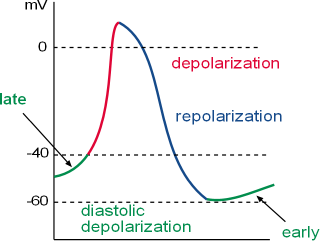
The graph shows how the membrane potential (i.e., charge at the inner surface of the cell membrane relative to the charge at the outer surface) changes over time. This pattern is repeated over and over. This cyclical pattern consists of:
- Depolarization (red) initiated by the opening of calcium channels leading to a rapid increase of positive charges to the inner surface. It begins at a membrane potential (vertical axis in millivolts, mV) of ~-40mV (threshold) as shown on the graph.
- Repolarization (blue) is due to the loss of potassium ions that removes positive charges from the inner-membrane surface.
- Diastolic depolarization (green) (a.k.a.; pacemaker potential) begins at ~-60mV (mean diastolic potential, MDP) as shown on the graph. It initially involves both a gain of sodium ions through membrane channels leading to an interaction between calcium ions from the sarcoplasmic reticulum and external environment with sodium-calcium exchangers in the cell membrane.
Depolarization
At 'threshold' calcium channels in the cell membrane open rapidly allowing a large influx of calcium ions. These ions strongly activate sodium-calcium exchangers in the cell membrane that rapidly return one calcium ion to the outside in 'exchange' for three sodium ions. This occurs very rapidly causing the sharp upswing in the graph.
In addition to activating the exchangers, the 'external' calcium ions also trigger calcium channels of the sarcoplasmic reticulum to open. These continue the activation of the exchangers. The exchangers cease to function as the membrane potential enters the positive range and calcium ions remaining in the cytoplasm are returned to the sarcoplasmic reticulum.
Repolarization
Membrane calcium channels close very soon after opening while potassium channels are simultaneously opening. As the loss of positive charge (K+) becomes greater than the gain (Ca++), the curve changes direction and heads downward. As the membrane potential becomes more negative the potassium channels begin closing. Simultaneously, sodium (pacemaker) channels begin opening causing the steepness of this downward portion of the curve to begin to level out.
Diastolic Depolarization
- Early diastolic depolarization begins when the gain of positive charge (Na+) through pacemaker channels
exceeds the loss of positive charge (K+) causing the curve to change from a downward to an upward direction. This usually
occurs at ~-60mV (mean diastolic potential (MDP)) as indicated in the graph.
As the membrane potential becomes more positive calcium channels open allowing a small influx of ions. These few ions mildly activate sodium-calcium exchangers in the cell membrane to remove one calcium ion (Ca2+) from the cell in exchange for three sodium ions (3 Na+).
- Late diastolic depolarization is characterized by the added activity of the sarcoplasmic reticulum. This organelle cyclically releases small 'spurts' of calcium ions, the size of which dependents on how many ions are stored within the organelle. These calcium ions increase the activation of the sodium-calcium exchangers thus enhancing the rate of sodium entering the cell. This is reflected in the change in shape of the curve from linear to exponential (not shown in this graph).
Double-click the next section in the Menu.
Design of the Pacemaker Model
As you read through each section below, scroll back up to the top of the page
and locate the part
of the model being described or print a copy.
The intent of this section is to describe the design of the model ... not to explain what is happening. This section will actually be most useful after you have completed all the upcoming sections. When you have studied all the sections ... which will fully explain the model ... come back to this section. You will find it to be an excellent summary.
Key to the arrows:
- Solid black arrow shows a chemical change.
- Dashed black arrow shows a stimulatory (+) or inhibitory (-) affect.
- Colored arrow shows movement of an ion.
The Pacemaker
The pacemaker (sinoatrial node, SAN) is a patch of specialized, excitatory cells embedded in the inner wall of the right atrium. "Bottom line up front" is that the repetitive production of a brief, positive spike in the action potential (AP) of these cells is the cause of the onset of each beat of the heart. The frequency with which these AP spikes occur can be modified by the activity of the two divisions of the autonomic nervous system (ANS); sympathetic (SNS) activity increases the heart rate while parasympathetic (PSNS) activity decreases it.
Action Potential
Repolarization
The membrane components of the model are situated on a large dotted circle representing a cell membrane. At the very top is a small grey ATP circle representing sodium/potassium pumps that move 2 K+ into the cell and 3 Na+ out (arrows labeled 2 and 3). To the left, a K+ is shown leaving the cell (purple arrow) through a Kr channel. A portion of the AP graph is shown within the cycling potassium ions; the purple part of the curve depicts this loss of positive charge (K+) due to this potassium current.
KACh (pink) is a type of potassium channel stimulated (+) by the PSNS that increases the overall potassium current as indicated by the pink arrow that joins the purple one. This increase in the potassium current causes a more negative mean diastolic potential (MDP) as suggested by the pink line in the graph.
Diastolic Depolarization
Early
To the right of the sodium/potassium pump is a section of the AP graph (light blue) called early diastolic depolarization that occurs after repolarization. HCN (hyperpolarization-activated cyclic nucleotide-gated) channels (light blue) allow the diffusion of Na+ into the cell creating a sodium current (light blue arrow). This gain of positive charge changes the direction of the AP curve from downward to upward. The sodium ions are later removed from the cell by the sodium/potassium pumps as shown by the black '3' arrow.
There is a long dashed black arrow pointing to (+) beside the HCN channel. The arrow arises from cAMP within the cytoplasm. The (+) symbol indicates that when cAMP is present it stimulates the HCN channels to open sooner than usual and also increases the sodium current.
Late
The red arrow indicates Ca2+ entering the cell through CaT channels. These calcium ions are the first to activate (dashed black arrow between Ca2+ and NCX) the sodium/calcium exchangers (NCX) that move 1 calcium out of the cell in 'exchange' for three sodium ions. A second source of 'activating' Ca2+ is the sarcoplasmic reticulum (SR, mushroom). This organelle cyclically releases small spurts of Ca2+ called local calcium releases (LCR purple arrow).
These events cause the AP curve to change from linear to exponential as indicated by the green line in the graph.
Depolarization
The final section of the AP graph (blue) shows an incoming Ca2+ current (blue arrow) through CaL channels. This large calcium current causes a sharp rise in the AP curve (blue line in graph) by further activating sodium calcium exchangers (dashed black arrow) to increase the influxing sodium current (green arrow) and also stimulate (blue arrow) 'ryanodine receptors'; RyR2 channels in the SR to open and release stored Ca2+ ('calcium-induced calcium release'; CICR purple arrow) that is also removed by the exchangers (green arrow). Calcium ions that are not moved out of the cell by the exchangers are moved back into the SR via 'sarcoplasmic reticulum calcium ATPase'; SERCA pumps (purple arrow). If the cytoplasmic concentration of Ca2+ becomes too high these ions are removed from the cell (thin blue arrow) by calcium pumps (grey ATP circle) in the cell membrane.
Autonomic Nervous System
The concentration of cyclic adenosine monophosphate (cAMP) is dependent on the relative activities of thesympathetic (SNS) and parasympathetic (PSNS) divisions of the autonomic nervous system. Epinephrine (E) and/or norepinephrine (NE) bind to membrane-bound beta receptors that cause the activation (+) adenyl cyclase (AC); acetylcholine (ACh) binds to membrane-bound muscarinic 2 receptors that inactivate (-) AC.
The extent of activation of membrane-bound AC governs the the extent of conversion of ATP to cAMP (curved arrow touching grey AC circle). As indicated by dashed arrows, cyclic AMP:
- increases (+) sodium influx through HCN channels,
- activates (+) phosphokinase A (PKA) , and
- is destroyed (-) by conversion to AMP by activated (+) phosphodiesterase (PD) .
The cytoplasmic PKA that is activated by cAMP (dashed arrow) causes additional effects indicated by dashed arrows. It:
- increases (+) calcium influx through CaL channels,
- increases (+) the pumping activity of SERCA,
- stimulates (+) RYR2 channels so they release more calcium ions, and
- activates (+) PD.
Double-click the next section in the Menu.
Phases
The action potential has been described
in several ways. Typically, the steep up (depolarization) and down (repolarizaton) sections of the graph have been called
the action potential with the more gradual incline between these sections called the prepotential or pacemaker potential.
It is now more common to refer to the entire graph as the action potential and to divide it into sections called diastolic depolarization (former
prepotential), depolarization and repolarization.
The reason the pacemaker is 'automatic' ... action potentials occurring one after the other ... has to do with the presence of voltage-activated channels in the membranes of these cells. The topics in this tutorial lead the reader through the behavior of each type of channel and how its activity affects other channels. The inward and outward diffusion of positive ions through these channels produces the repetitive action potentials characteristic of the cardiac pacemaker. That's right, there are no negative ions involved.
The concepts involved have been presented in the Electrophysiology Tutorial and should be studied before continuing with this tutorial.
Some Terminology
The three sections of the pacemaker action potential are labeled and color coded on the graph. The y-axis of the graph shows the membrane potential in millivolts (mV) and the x-axis is time. Accordingly, the graph depicts how the membrane potential changes over time. Depolarization is also called phase 0, repolarization is called phase 3 and diastolic depolarization is called phase 4. These numbers are taken from similar phases in the action potential of contracting heart cells ... they also have a phase 1 and 2 not found in the pacemaker action potential.
The term 'action potential' means that the membrane potential is not stable but is changing, i.e., action. As described in the Electrophysiology Tutorial, the 'membrane potential' is the charge, in millivolts (mV), at the inner-membrane surface, relative to the charge at the outer surface. When the inner charge is negative the membrane is said to be 'polarized'. When the charge is becoming less negative it is 'depolarizing' and when it is becoming more negative again it is 'repolarizing'. The term hyperpolarization is frequently encountered; it means the membrane potential is more (hyper-) negative than usual. The term 'diastolic' refers to the time between contractions when the heart is relaxing.
It is the flow of positive ions in and out of the cell, through the membrane, that causes the membrane potential to change. Positive ions flowing inward (influxing) make the charge at the inner surface less negative ... the membrane is depolarizing. Positive ions flowing outward (effluxing) make the charge at the inner surface more negative ... the membrane is repolarizing.
Heart Rate
The accumulation of positive charges at the action potential peak establishes a temporary gradient for these ions to diffuse through gap junctions into adjacent cells. This influx of positive charge causes the 'recipient' cell to depolarize ... producing its own 'peak' ... so that the next cell, and the next, and the next also depolarize. This wave of depolarization eventually reaches the contractile cells. Depolarization of contractile cells causes them to contract but they also allow positive ions to diffuse through their gap junctions to surrounding contractile cells, etc., etc., etc. So, the more rapidly pacemaker cells can produce 'peaks' the more rapidly the heart will contract.
Double-click the next section in the Menu.
Depolarization
 The section of the model to the left shows the influx of calcium ions through CaL channels.
These channels are 'long-lasting (L-type)' in cardiac contractile cells during the 'plateau' characteristic
of those cardiac cells. However, in cardiac pacemaker cells the calcium
influx is short lived because these ions
bind to calmodulin (Ca/CaM) that increases the rate of channel closing. However, the calcium current can be
extended by a sustained, rapid heart rate that results in channel phosphorylation by calcium/calmodulin-dependent kinase II (CaMKII).
The section of the model to the left shows the influx of calcium ions through CaL channels.
These channels are 'long-lasting (L-type)' in cardiac contractile cells during the 'plateau' characteristic
of those cardiac cells. However, in cardiac pacemaker cells the calcium
influx is short lived because these ions
bind to calmodulin (Ca/CaM) that increases the rate of channel closing. However, the calcium current can be
extended by a sustained, rapid heart rate that results in channel phosphorylation by calcium/calmodulin-dependent kinase II (CaMKII).
L-type Calcium Channel, CaL
Structure
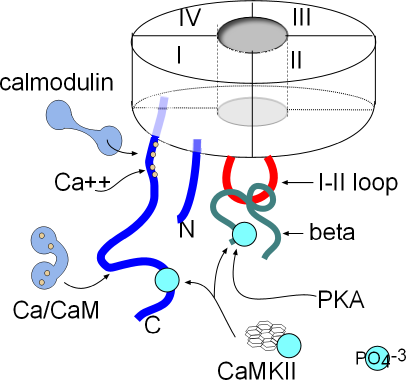 The basic structure of the membrane-embedded portion of the channel has been described in the Electrophysiology
Tutorial. In calcium channels, the four six-alpha-helix proteins are linked together forming one long
protein. When linked in this fashion, each of the original four proteins is called a domain (I-IV); they form
a circle around a central pore as shown in the inset.
The basic structure of the membrane-embedded portion of the channel has been described in the Electrophysiology
Tutorial. In calcium channels, the four six-alpha-helix proteins are linked together forming one long
protein. When linked in this fashion, each of the original four proteins is called a domain (I-IV); they form
a circle around a central pore as shown in the inset.
Both ends of this four-domain protein are suspended in the cytoplasm. Both are shown as blue lines in the illustration; the N-terminal (N) is from domain I and the C-terminal (C) is from domain IV. Also shown in the cytoplasm is a red loop from domain I to II that forms a 'hinged lid' type of inactivation gate. Inactivation is voltage-dependent but there are other mechanisms that affect the rate of inactivation.
If you are floundering at this point it is a hint that you will have to study the Electrophysiology Tutorial before preceding any further.
There are a number of sites where various cytoplasmic components can attach and modify the behavior of this channel. The C-terminal has two sites where calcium/calmodulin (Ca/CaM) can attach. CaMKII (calcium/calmodulin-dependent kinase II) can add a phosphate group (PO4-3) (light blue) at a site near the proximal end of the C-terminal and also to the beta protein. Phosphokinase A (PKA) can also attach a phosphate group to the beta protein.
Calcium Current, ICa
The symbol 'I' stands for current ... the net directional flow of charge. In the upcoming tutorials you will see action potential graphs with a grey 'current icon' superimposed over specific portions of the action potential (AP). In this situation it is positioned over the depolarization portion (red) of the AP. The width of the icon indicates how long the current lasts and is represented by its horizontal border. If the current is due to an influx of ions the horizontal border will be the top of the icon; if the current is effluxing the horizontal line will be the bottom of the icon. This icon shows in influxing current.
 Voltage-dependent activation of the L-type calcium channel occurs when the membrane potential reaches ~-40mV (threshold).
The channels open rapidly allowing a sudden and strong influx of calcium ions that causes the
upswing (red, depolarization) of the action potential. This point is marked by a vertical line that crosses the threshold
and the beginning of the icon's horizontal border. The shape of the icon indicates there is an instantaneous and large influxing
current ... shape of the left border of icon ... that immediately begins to decline rapidly, slowing slightly just before the current stops...
shape of the right border.
Voltage-dependent activation of the L-type calcium channel occurs when the membrane potential reaches ~-40mV (threshold).
The channels open rapidly allowing a sudden and strong influx of calcium ions that causes the
upswing (red, depolarization) of the action potential. This point is marked by a vertical line that crosses the threshold
and the beginning of the icon's horizontal border. The shape of the icon indicates there is an instantaneous and large influxing
current ... shape of the left border of icon ... that immediately begins to decline rapidly, slowing slightly just before the current stops...
shape of the right border.
The extensive length of the left border reflects the force of the 10,000:1 calcium concentration gradient that drives this strong current. The vertical nature of the border indicates that the activation gates of essentially all the channels open fully and simultaneously. Voltage-dependent inactivation begins at the bottom point of the current icon. The shape of the right border of the icon indicates that some of the channels' inactivation gates (I-II loops) close immediately, followed by inactivation gate closures of the remaining channels. When the right border reaches the top horizontal border the current has ended; all channels are closed.
A second vertical line passes through the peak of the action potential and marks the end of depolarization. However, the small red downward moving portion indicates that a small calcium current is still occurring during the beginning of repolarization. Notice the corresponding portion of the grey 'current icon'.
Modulation of Current
Calcium current (ICa) can be decreased by calcium/calmodulin binding at sites shown in the above illustration. The current can be increased when the channels are phosphorylated by calcium/calmodulin-dependent Kinase II (CaMKII) ... when the heart rate is rapid and sustained ... and by PKA due to sympathetic nervous system activity.
Calcium-Dependent Inhibition, CDI
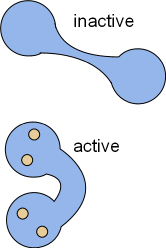
Calcium ions influxing through CaL channels and from the sarcoplasmic reticulum will binds with calmodulin, CaM (CALcium MODULatINg). This ubiquitous protein is dumbbell-shaped when inactive but, upon activation by the binding of four calcium ions, changes shape as shown in the illustrations. In the bent form, calcium/calmodulin (Ca/CaM) can wrap around proteins that have calmodulin binding sites. When so wrapped the activity of the target is altered.
As shown in the above illustration of the structure of CaL channels there are two such sites; one near the internal pore opening and the other further out on the C terminus. The site nearest the pore directly binds Ca2+ and then calmodulin attaches to them and bends. The other site binds calcium/calmodulin that has formed in the cytoplasm. These bindings cause the inactivation gate to close more rapidly thus inhibiting the calcium current and preventing calcium overload. This closure is more rapid than than the normal voltage-dependent inactivation described above.
Calcium-Dependent Facilitation, CDF
 A 'kinase' is an enzyme that phosphorylates its target molecule; this causes a conformational change in the target and alters
its behavior. Calcium/calmodulin-dependent kinase II (CaMKII) is a ubiquitous enzyme with a very complicated structure as seen
at the left. It is composed of twelve separate enzymes in a double stack; these enzymes are activated by the binding of Ca/CaM. The Ca/CaM
activates the kinase so that it hydrolyzes ATP retaining the phosphate group that it will add to its targets. The
above illustration shows two sites on CaL channels that CaMKII will phosphorylate (light blue circles). The
resulting phosphorylation of these channels interferes with the ability of Ca/CaM to close the inactivation gates. Thus, calcium-dependent
facilitation (CDF) extends the calcium current through CaL channels.
A 'kinase' is an enzyme that phosphorylates its target molecule; this causes a conformational change in the target and alters
its behavior. Calcium/calmodulin-dependent kinase II (CaMKII) is a ubiquitous enzyme with a very complicated structure as seen
at the left. It is composed of twelve separate enzymes in a double stack; these enzymes are activated by the binding of Ca/CaM. The Ca/CaM
activates the kinase so that it hydrolyzes ATP retaining the phosphate group that it will add to its targets. The
above illustration shows two sites on CaL channels that CaMKII will phosphorylate (light blue circles). The
resulting phosphorylation of these channels interferes with the ability of Ca/CaM to close the inactivation gates. Thus, calcium-dependent
facilitation (CDF) extends the calcium current through CaL channels.
It is noteworthy that activation of this kinase requires a high cytoplasmic concentration of calcium ions not found under basal conditions. However, when there is a sustained, rapid heartbeat, such as during sympathetic stimulation, sufficient calcium does accumulate in the cytoplasm. Additional, under these conditions, there is a higher than normal concentration of phosphokinase A (PKA) that also phosphorylates CaL channels.
Double-click the next section in the Menu.
Repolarization
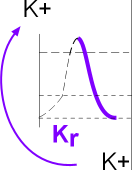 The model inset shows that repolarization is due to potassium efflux through rapid delayed rectifier channels (Kr). This initial potassium current is small;
it coexists with a small but declining calcium current described in the previous section.
When the membrane potential becomes negative, the potassium current exhibits a significant increase ... the calcium current having
ended ... and the membrane potential rapidly becomes more negative.
The model inset shows that repolarization is due to potassium efflux through rapid delayed rectifier channels (Kr). This initial potassium current is small;
it coexists with a small but declining calcium current described in the previous section.
When the membrane potential becomes negative, the potassium current exhibits a significant increase ... the calcium current having
ended ... and the membrane potential rapidly becomes more negative.
Rapid Delayed Rectifier Potassium Channels, Kr
The structure of these channels is still a topic of intense investigation. The following descriptions of the various states of these channels are intended to provide a framework to help understand how they function. The following requires prior knowledge of information presented in the Electrophysiology Tutorial.
Channel Configurations
This channel consists of four separate proteins; the cytoplasmic N and C terminals comprise ~80% of each protein ... though this is not the impression given in the following illustrations. The four proteins are arranged in a circle leaving a pore between them. The following series of illustrations show two of the four proteins on either side of the pore.
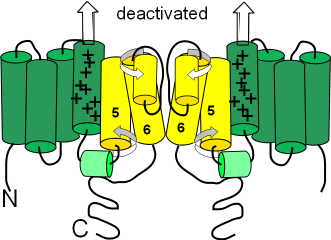
Activated
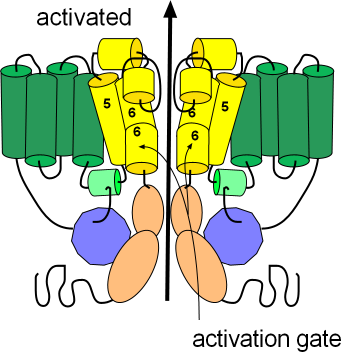
This illustration shows the channel in its open or activated state as indicated by the black arrow passing through the pore. The sensor domain, S1-S4, is shown in green while the pore domain, S5-S6, is shown in yellow. The S6 helices, lining the pore, are hinged and their cytoplasmic ends are bent downward so as not to occlude the pore. These hinged regions form the activation gate.
The ends of each protein extend into the cytoplasm; the N terminus is from the S1 helix while the C terminus is from S6; notice portions of these terminals are attached to each other (purple/peach). The C-terminal has two coiled sections (peach) with a long flexible extension after that. The N-terminal consists of a relatively long flexible section with a coiled section (purple) near the end. A short extension follows the coil and is referred to as a 'tail'. With the channel in the open position this tail attaches to a small helix (light green); this attachment might help stabilize the open conformation.
There are short segments that run between the membrane-embedded helices (green and yellow); two of these 'linkers' have short helices of their own. The helix (light green) of the cytoplasmic S5S6 linker is where the 'tail' of the N-terminal attaches to help stabilize the open configuration. The outer S5S6 linker is fairly long and has two helices (yellow). One helix lies at the external surface followed by a fairly long extension that hangs into the pore itself; this extension folds back upward after forming the second helix. The extension hanging into the pore forms part of the selectivity filter that permits the passage of only potassium ions.
Deactivated
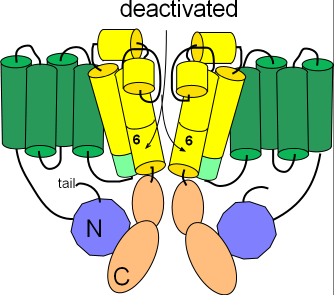
Several changes occur to form the deactivated channel as shown in the second illustration. The pore closes when the hinged portions of the S6 helices bend toward each other. Additionally, the helix on the S4S5 linker (light green) is repositioned to align with the cytoplasmic end of S5. Careful inspection shows that the tail of the N-terminal is no longer in contact with this helix.
Inactivated
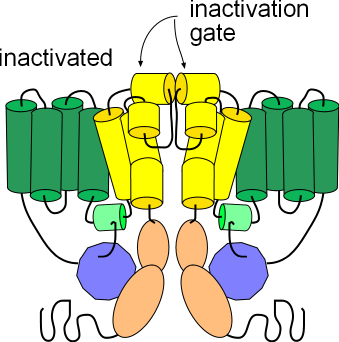
The third illustration shows the channel in the inactivated state. Its conformation is the same as the activated state but the helices (yellow) at the external membrane surface have moved toward each other obstructing the opening of the pore. These small helices form the inactivation gate. Note that this conformation, like the deactivated state above, will not allow the passage of ions; inactivation must be removed in order for ions to pass through.
Potassium Current, IKr
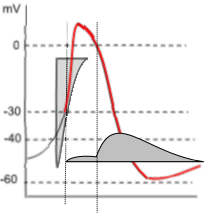 The graph to the left shows both the potassium current icon (darker grey) and the lighter calcium current icon of depolarization.
Unlike the prior calcium current, the potassium current is due to effluxing ions thus the horizontal line of the current icon forms
its lower border. Note that the potassium current begins halfway through depolarization and continues into diastolic
depolarization where the curve turns upward.
The graph to the left shows both the potassium current icon (darker grey) and the lighter calcium current icon of depolarization.
Unlike the prior calcium current, the potassium current is due to effluxing ions thus the horizontal line of the current icon forms
its lower border. Note that the potassium current begins halfway through depolarization and continues into diastolic
depolarization where the curve turns upward.
The shape of the potassium current icon (dark grey) indicates that initially (first vertical line) there is only a very small, steady current. However, when the membrane potential drops back to 0mV (second vertical line) there is a sudden increase in the potassium current that quickly reaches a maximum then begins a slow decline. This decline extends beyond the end of repolarization and into diastolic depolarization.
This unusual current is due to the gating behavior of these channels. During depolarization, when the membrane potential reaches ~-30mV , the activation gates open followed quickly (rapidly: Kr) by the closure of the inactivation gates that block the current. However, the inactivation gates don't stay closed very well and, about 10% of the time, they open briefly. It is during these brief, unsynchronized openings that a small current flows. But, when the membrane potential repolarizes to ~0mV (second vertical line), the inactivation gates begin to 'lock' open leading to a maximum current. Gradual closure of the activation gates (deactivation) is the cause of the slow decay of the current.
Double-click the next section in the Menu.
Early Diastolic Depolarization
 The heart muscle itself is triggered to beat (systole) due to the accumulation of positive charges at the peak of the pacemaker AP.
The rest period between successive beats is called diastole; during this time the pacemaker membrane potential is undergoing
diastolic depolarization.
The heart muscle itself is triggered to beat (systole) due to the accumulation of positive charges at the peak of the pacemaker AP.
The rest period between successive beats is called diastole; during this time the pacemaker membrane potential is undergoing
diastolic depolarization.
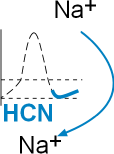
The model inset shows the influx of sodium ions through the HCN channel. The change in pacemaker membrane potential during this time is a slow, gradual upward slope due to the influx of sodium ions through hyperpolarization-activated cyclic nucleotide-gated channels (HCN). These channels were originally called 'funny' channels because they activate during repolarization while other channels activate during depolarization. The influxing sodium current competes with the effluxing potassium current and is responsible for the 'turnaround' in the AP at the end of repolarization.
Hyperpolarization-activated Cyclic Nucleotide-gated Channels (HCN)
The 'hyperpolarization-activated' part of the channel's name indicates that they, unlike other channels, activate during repolarization. These channels are additionally unique in that they do not have inactivation gates. They are mixed channels that preferentially allow the influx of sodium ions but also allow some efflux of potassium ions. They are often called 'pacemaker channels' because the autonomic nervous system can modify their gating behavior thus changing the heart rate.
Configuration
The mechanisms involved in the gating behavior of these channels is still under investigation. The following is one of several theories concerning gating and is presented here as a conceptual model.
This channel is composed of four separate proteins arranged in a circle around a central pore. The S1-S4 membrane-embedded helices (sensor domain) are represented as green cylinders and the pore domain is represented by the yellow cylinders. The S4 helices each have nine positive charges instead of the customary four or five. There is a small helix (light green) on the cytoplasmic S4S5 linker. The external S5S6 linker has a small helix (yellow) extends down into the pore forming the selectivity filter that determines which ions may pass. Only two of the four proteins are illustrated here.
Deactivated
The term 'deactivated' means the activation gates are closed. (Not having an inactivation gate these channels can not 'inactivate'.) The first illustration shows the deactivated configuration that exists when the charge at the inner-membrane surface (bottom of illustration) is not sufficiently negative to hold the S4 sensor helices down (see block arrows pointing toward outer-membrane surface). The small helix (light green) on the S4S5 linker lies horizontally. The S5 and S6 helices are twisted (curved arrows) in such a way that the cytoplasmic ends of the S6 helices block the pore.
Activated
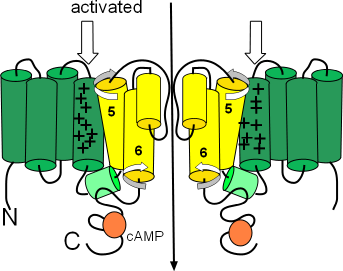
The second illustration shows the activated configuration. The block arrows show the S4 helices held down when the charge at the inner-membrane surface is sufficiently negative to do this. As a result, the cytoplasmic ends of the S6 helices move and no longer block the pore. One hypothesis suggests that the downward position of the S4 helices push down on one end of the small S4S5 linker helices (light green) so that their other ends are lifted. This may cause the S5 and S6 helices to twist (curved arrow) and unblock the pore.
The orange circles represent binding sites for cyclic AMP (cAMP). When bound, this cyclic nucleotide ... the 'CN' part of the channels' name ... causes channel activation at a less negative membrane potential thus starting diastolic depolarization sooner.
Funny (Sodium) Current, If
 This graph emphasizes the early diastolic depolarization section (red) of the AP curve.
Two 'current icons' are shown indicating that the effluxing potassium current (lighter grey) and the influxing sodium current (darker grey)
occur simultaneously. Keep in mind that the relative position of the horizontal border of a 'current icon' indicates whether the current
is influxing or effluxing. If the current is effluxing, like potassium, the horizontal border is at the bottom; if influxing, like sodium,
it is at the top.
This graph emphasizes the early diastolic depolarization section (red) of the AP curve.
Two 'current icons' are shown indicating that the effluxing potassium current (lighter grey) and the influxing sodium current (darker grey)
occur simultaneously. Keep in mind that the relative position of the horizontal border of a 'current icon' indicates whether the current
is influxing or effluxing. If the current is effluxing, like potassium, the horizontal border is at the bottom; if influxing, like sodium,
it is at the top.
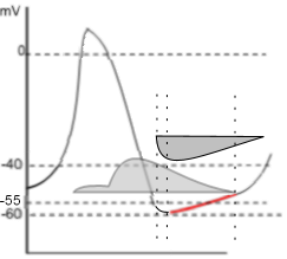
The HCN channels begin activating at ~-55mV (first vertical dashed line) near the end of repolarization. The shape of the left border of the sodium 'current icon' indicates the maximum current is reached very quickly pushing the membrane potential to ~-60mV (second dashed line). This 'low point' of the AP is called the mean diastolic potential (MDP). The shape of the right border of the icon indicates a slowly decreasing current that continues after the potassium current has ended (third dashed line).
In the region between the second and third vertical dotted lines both the potassium and sodium currents are decreasing. However, because the decrease in the potassium current is faster than the decrease in the sodium current, there is a net gain in positive charge as indicated by the red region of the AP curve. After the third dotted line, when the potassium current has ended, the AP curve begins changing from linear to exponential (curved); this marks the change from early to late diastolic depolarization.
Double-click the next section in the Menu.
Late Diastolic Depolarization
 Late Diastolic Depolarization is characterized by the exponential section of the AP curve. This acceleration in the rate of
change of the curve is due to the activity of the sodium/calcium exchangers (NCX) that are activated by calcium ions. Cytoplasmic calcium
ions are moved out of the cell in exchange for three sodium ions ... a net gain of positive charge.
Late Diastolic Depolarization is characterized by the exponential section of the AP curve. This acceleration in the rate of
change of the curve is due to the activity of the sodium/calcium exchangers (NCX) that are activated by calcium ions. Cytoplasmic calcium
ions are moved out of the cell in exchange for three sodium ions ... a net gain of positive charge.
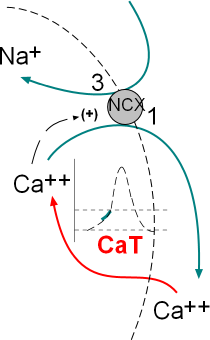
The model inset shows the calcium current, through transient calcium channels (CaT), and the exchange of three sodium ions for one calcium by sodium/calcium exchangers (NCX). These activities occur simultaneously; the green section of the AP graph shows the effect on the membrane potential.
Structure of Membrane Channel and Exchanger
Transient Calcium Channels, CaT
These channels have a structure similar to CaL channels described in the depolarization section of this tutorial but do not have the beta subunit. Since they are not too abundant the current through them is small. They activate at a relatively low voltage (~-55mV) and are often referred to as low-voltage activated channels.
Sodium/Calcium Exchanger, NCX
Exchangers are membrane-embedded proteins that move one type of ion through the membrane in exchange for another type of ion. They are not voltage-dependent but are controlled by the binding of a 'ligand'. A ligand is a substance (usually a small molecule) that forms a complex with another molecule to serve a biological purpose. In this case the 'ligand' is Ca2+ that binds at the inner-membrane surface of the exchanger.
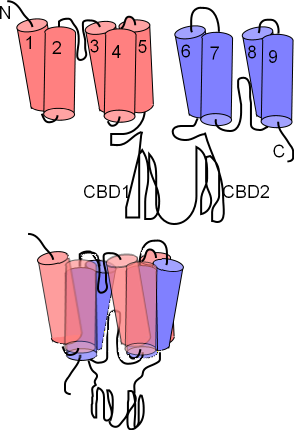
The NCX exchanger has nine membrane-embedded helices connected by loops of various sizes. The first illustration shows this extended structure. Each helix is called a transmembrane sequence (TMS); TMS 1-5 constitute 'alpha unit 1' (pink) while TMS 6-9 constitute alpha unit 2 (lavender). Between TMS 2 & 3 and between TMS 7 & 8 there are short reentrant loops. A pair of large cytoplasmic loops, CBD1 and CBD2, extend into the cytoplasm; these have Ca2+ binding sites.
The next illustration shows how the helices are arranged within the membrane; the two alpha units lying atop one another so that the two reentrant loops are brought close together. Close inspection shows these two 'hairpins' lined up; Na+ and Ca2+ binding sites are within this region
These exchangers can operate in either a forward (calcium out/sodium in) or a reverse (sodium out/calcium in) mode. The concentrations of sodium and calcium ions plus the membrane potential itself determine which mode operates.
Late Diastolic Depolarization Currents
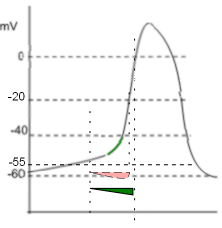
The graph shows two 'current icons' occurring simultaneously. The pink 'icon' represents a calcium current entering the cell through CaT channels. The green 'icon' represents a sodium current entering due to the activity of sodium/calcium exchangers.
Calcium Current, ICa
The shape of the icon (pink) indicates that these channels begin opening at ~-55mV (first vertical line) and inactivate rapidly at ~-20mV (second vertical line). Compared to the CaL channels that drive the depolarization of the AP (that open at ~-40mV, 'threshold') these are low-voltage activated ... -55 is lower than -40. The positive charge brought into the cell via these channels is not the main contributor to the exponential shape of late diastolic depolarization as described below.
Sodium Current, INa, Forward Mode
The activity of the exchangers depends on several factors. First, there must be a sufficiently high concentration of cytoplasmic Ca2+ to bind to the CDC1 and CDC2 sites on the exchangers' cytoplasmic loops. The greater the number of Ca2+ bound to these sites the greater the rate of exchange of 1 Ca2+ for 3 Na+. Each exchanger can remove as many as 5,000 Ca2+ per second. Accordingly, it is not the build up of Ca2+ from CaT channels that accounts for the exponential increase in the AP but rather the Na+ that the exchangers bring into the cell.
Additionally, the membrane potential must be negative for the exchangers operate in the 'forward mode' ... calcium ions are moved out of the cell and sodium ions moved in. The green 'current icon' indicates that the sodium current abruptly stops when the membrane potential reaches 0mV (third vertical line).
Double-click the next section in the Menu.
Calcium Clock
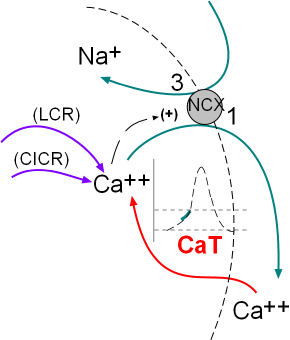 The activity of the NCX exchangers is also activated by calcium ion release from the sarcoplasmic reticulum (SR). The initial
release is called local calcium release (LCR) and occurs simultaneously with the influx of calcium through the CaT channels.
The second release called calcium-induced calcium release (CICR) is during depolarization; this represents a 'tick' of the calcium clock.
The model inset shows these activities.
The activity of the NCX exchangers is also activated by calcium ion release from the sarcoplasmic reticulum (SR). The initial
release is called local calcium release (LCR) and occurs simultaneously with the influx of calcium through the CaT channels.
The second release called calcium-induced calcium release (CICR) is during depolarization; this represents a 'tick' of the calcium clock.
The model inset shows these activities.
Previous sections of this tutorial described the structure and function of the various membrane-bound channels and exchangers that produce the pacemaker action potential. That series of voltage-regulated activities has been named the 'membrane clock'. Research during the past few decades has verified that the cyclical release of calcium from the sarcoplasmic reticulum, the 'calcium clock', also plays an important role in modifying this action potential.
Sarcoplasmic Reticulum
The histology of pacemaker cells is quite different from that of myocardial contractile cells. Pacemaker cells are spindle or stellate shaped and extremely small with a diameter of only 4nm. They are densely covered with caveloli ... small flask-shaped indentations ... that accounts for 50% of their surface area. They have few and unorganized myofilaments, numerous mitochondria and a sarcoplasmic reticulum (SR) found throughout the cytoplasm. The sections of SR that abut the sarcolemma (cell membrane) are referred to as 'junctional' while the remaining sections are referred to as 'network'.
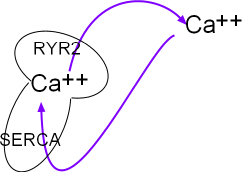
This small model inset illustrates the sarcoplasmic reticulum (SR) as a mushroom. Calcium ions are pumped into it by the activity of sarcoplasmic reticulum calcium ATPase (SERCA) located in the organelle's network membrane. These ions diffuse toward and accumulate beneath ryanodine receptor channels (RYR2) located in the junctional membrane. When the RYR2 channels open the ions diffuse into the cytoplasm just beneath the cell membrane. From there they are either removed by NCX exchangers or returned (purple arrows) to the lumen of this organelle by SERCAs.
Structure of SR Membrane Components
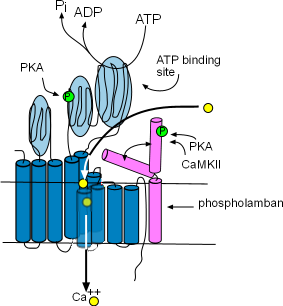
Sarcoplasmic Reticulum Calcium ATPase (SERCA)
These enzymes are bound to the membrane of the SR in the network region and are responsible for refilling the SR lumen. Using the energy released by ATP, they pump Ca2+ from the cytoplasm into the lumen (interior) of the SR. The illustration shows that this enzyme is composed of ten helices (dark blue) and large cytoplasmic loops (light blue). There are binding sites for phosphokinase A (PKA) to phosphorylate (green 'P' circle) the enzyme and ATP to provide the energy source. The yellow circles show that Ca2+ is transported into the SR lumen between the helices.
Phospholamban (pink) is a two-helix protein closely associated with SERCA. The illustration shows that it can assume two conformations, one in which a helix is bent over a portion of SERCA blocking the calcium ion pathway and the other unbent shape that does not obstruct the pathway. The double-headed arrow represents the conversion of one conformation to the other.
Phosphorylation by Ca2+-calmodulin-dependent protein kinase (CaMKII) and PKA favors the 'open' conformation and increase the pumping rate filling the lumen faster. The concentration of CaMKII increases during depolarization; the concentration of PKA is controlled by the autonomic nervous system.
Ryanodine Receptors (RYR2)
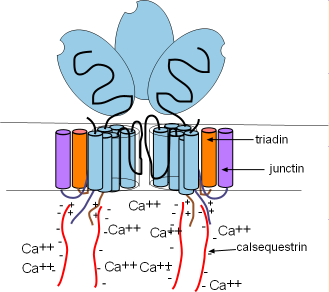
Ryanodine receptors are embedded in the SR membrane at the junctional region that is located just beneath the cell membrane. They are channels that open to release Ca2+ into the cytoplasm. RYR2s are arranged in groups called 'calcium release units' (CRUs). There are ~10,000 CRUs per cell, with 100 RYRs each, giving a total of ~1,000,000 RYRs per cell.
These channels are ~10X larger than most other channels. Each consists of four separate proteins referred to as 'monomers' (light blue) that are arranged around a pore. Only two are illustrated here with a potion of a third shown between them. Several helices pass through the SR membrane with a large (light blue oval) cytoplasmic foot containing several binding sites.
There are two other membrane-embedded proteins associated with each monomer; triadin (orange) and junctin (purple). Each consists of one alpha helix and a positively-charged C terminal extending into the cytoplasm . Within the lumen of the SR, negatively-charged calsequestrin (CASQ2) molecules (long wavy red lines) bond to these positive sites as shown in the illustration. These groupings are called a calcium-sensing receptors.
Control Mechanisms
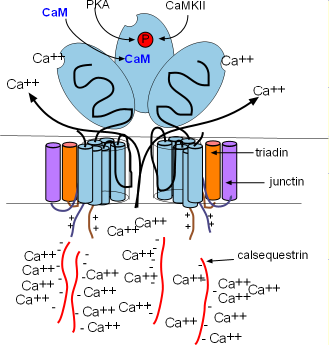
The calcium-sensing receptors cause the channels to open when luminal Ca2+ concentrations increase (intrinsic control). This occurs when Ca2+ bind to calsequestrin (CASQ2) molecules detaching them from the calcium-sensing receptors as shown in the illustration. Calcium released by this mechanism is called a local calcium release (LCR). Extrinsic control occurs when binding sites on the feet open the channels in response to high concentrations of Ca2+ and PKA in the cytoplasm. Calcium released by this mechanism is called calcium-induced calcium release (CICR).
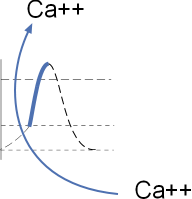
.Intrinsic Control & LCR
SERCAs pump continually so that Ca2+ is always filling the SR and diffusing toward the RYR2s in junctional regions. As more and more Ca2+ attaches to the calcium-sensing receptors the CASQ2 molecules will detach and open the channel as described above. This causes a local calcium release (LCR) from the SR. This loss of luminal Ca2+ is restored as Ca2+ unbinds from CASQ2s allowing them to reattach to the RYR2s and close the channels as shown in the first illustration.
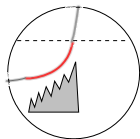
Individual LCRs occur rapidly, each starting before the preceding one has ended, causing the stair-step pattern shown in this illustration. This is thought to occur because binding of LCR Ca2+ to the RYR2 feet makes them more likely to respond to internal Ca2+ supplies.
Extrinsic Control & CICR
Calcium-induced calcium release (CICR) occurs when the influx of Ca2+ through CaL channels attaches to RYR2 binding sites on RYR2 'feet' holding those channels open until ~66% of the remaining Ca2+ in the SR has been released. The channels close when sufficient cytoplasmic Ca2+ have been removed by (1) the NCX exchangers (2) SERCA or, (3) membrane-bound calcium pumps. The activity levels of each of these depends on the concentration of Ca2+ in the cytoplasm.
Coupled Clocks
The intrinsic control mechanism of the sarcoplasmic reticulum causes the release of 'spurts' of Ca2+ (LCRs) that increase the activation of membrane-bound NCX exchangers. Additionally, the rapid influx of Ca2+ through the membrane-bound CaL channels opens the RYR2 channels of the SR causing a second Ca2+ release (CICR). In this manner the activities of membrane-bound components (membrane clock) and activities of reticulum-bound components (calcium clock) interact; the clocks are doubly coupled together.
Double-click the next section in the Menu.
ANS
The rate at which pacemaker action potentials are produced is controlled by the effects of the autonomic nervous system (ANS) on both the membrane and calcium clocks. This involves 'first messengers' from the ANS that target membrane receptors followed by 'second messengers' that target both membrane channels and components of the sarcoplasmic reticulum.
Autonomic Nervous System
The autonomic nervous system (ANS) increases the rate at which pacemaker action potentials are produced via its sympathetic division (SNS) and decreases this rate via its parasympathetic division (PSNS). It does this by releasing neurohormones from neurons that enter the sinoatrial node (a.k.a., pacemaker) and by hormones released into the bloodstream from the adrenal medulla. These compounds attach to specific membrane-bound proteins called receptors. These receptors initiate a series of reactions that modify the activity of many of the previously described ion channels and pumps.
First Messengers
Neurohormones and hormones, that bind to receptors at the outer cell surface, are called 'first messengers'. The SNS secretes the hormones epinephrine (E) (a.k.a, adrenaline) and norepinephrine into the bloodstream and releases the neurohormone norepinephrine (NE) from the endings of neurons. The neurohormone acetylcholine (ACh) is released from PSNS neuron endings. Membrane-bound receptor proteins have binding sites for these messengers. Pacemaker cells have beta (B) receptors that bind epinephrine and norepinephrine and muscarinic 2 (M2) receptors that bind acetylcholine.
Receptors
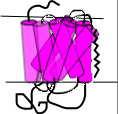 Both of the above mentioned receptors are G protein-coupled receptors (GPCRs).
These membrane-embedded proteins consist of seven alpha helices (pink) as shown in the illustration. The N terminus is in the extracellular
fluid (top) and the C terminus is intracellular (bottom). Note the intracellular loop that will serve as an attachment site for
G-proteins (see below). The first messenger binds between the helices within the membrane.
Both of the above mentioned receptors are G protein-coupled receptors (GPCRs).
These membrane-embedded proteins consist of seven alpha helices (pink) as shown in the illustration. The N terminus is in the extracellular
fluid (top) and the C terminus is intracellular (bottom). Note the intracellular loop that will serve as an attachment site for
G-proteins (see below). The first messenger binds between the helices within the membrane.
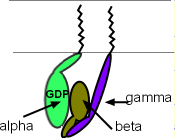 A G protein consists of three subunits as shown in the next illustration. These subunits 'dangle' into the cytoplasm
but two of them are anchored to the membrane (zig-zag lines). The alpha (green) and gamma (purple) subunits are membrane-anchored while
the beta subunit is firmly attached to the side of the gamma subunit ... forming a 'dimer' ... but is only lightly attached to the side of the alpha subunit.
Note that the alpha subunit has a molecule of guanine diphosphate
(GDP) attached ... thus the name 'G' protein. When the subunits are together as illustrated, and there is a GDP with the alpha subunit,
the G-protein can attached to the loop at the cytoplasmic
surface of the receptor as shown in the next illustration.
A G protein consists of three subunits as shown in the next illustration. These subunits 'dangle' into the cytoplasm
but two of them are anchored to the membrane (zig-zag lines). The alpha (green) and gamma (purple) subunits are membrane-anchored while
the beta subunit is firmly attached to the side of the gamma subunit ... forming a 'dimer' ... but is only lightly attached to the side of the alpha subunit.
Note that the alpha subunit has a molecule of guanine diphosphate
(GDP) attached ... thus the name 'G' protein. When the subunits are together as illustrated, and there is a GDP with the alpha subunit,
the G-protein can attached to the loop at the cytoplasmic
surface of the receptor as shown in the next illustration.
G-protein Activation
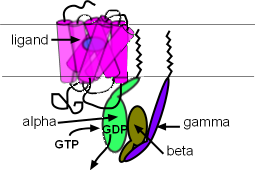 This illustration shows a ligand/first messenger (blue oval) binding to the receptor. When this occurs the
GDP of the alpha subunit is replaced by a guanine triphosphate (GTP). As a result, the alpha subunit detaches from both
the receptor loop and the beta/gamma dimer . These two parts of the G protein can now diffuse away from the receptor
but they always remain just below the membrane surface because they are anchored to it. The alpha subunit's 'target' is a membrane-bound enzyme
called adenyl cyclase (AC) and the target of the beta/gamma dimer is a potassium channel; both are located nearby.
This illustration shows a ligand/first messenger (blue oval) binding to the receptor. When this occurs the
GDP of the alpha subunit is replaced by a guanine triphosphate (GTP). As a result, the alpha subunit detaches from both
the receptor loop and the beta/gamma dimer . These two parts of the G protein can now diffuse away from the receptor
but they always remain just below the membrane surface because they are anchored to it. The alpha subunit's 'target' is a membrane-bound enzyme
called adenyl cyclase (AC) and the target of the beta/gamma dimer is a potassium channel; both are located nearby.
Second Messengers
The second messengers, cyclic adenosine monophosphate (cAMP) and phosphokinase A (PKA), are small molecules that are synthesized in the cell in response to extracellular first messengers, and diffuse through the cytoplasm to affect their targets. The subunits of G proteins are not second messengers but the alpha subunits and beta/gamma dimers do serve as 'middlemen' leading to the production of second messengers.
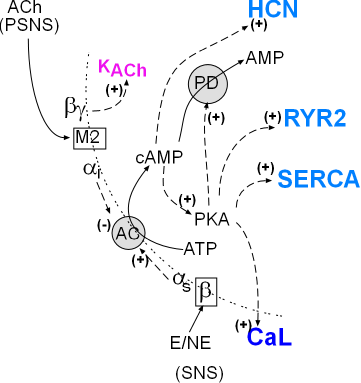
The model inset summarizes the pathways of the autonomic nervous system involving the cardiac pacemaker. The SNS activation produces first messengers epinephrine (E) and norepinephrine (NE) that bind with the membrane-bound beta receptors . Activated beta receptors release stimulatory alpha subunits (alphas) that diffuse (dashed arrow) to adenylcyclase (AC) and activate (+) it.
PSNS activation produces the first-messenger acetylcholine (ACh) that binds with muscarinic 2 receptors (M2). Activation M2 receptors release alphai and beta/gamma that diffuse (dashed arrow) along the cell membrane toward their targets. On contact, the inhibitory alpha subunit (alphai) inhibits adenyl cyclase (AC) activity reducing the associated cytoplasmic events. The beta/gamma dimer opens (+) normally closed KACh channels increasing making the overall membrane potential more negative.
Sympathetic Division
SNS activation of adenyl cyclase causes the conversion of cytoplasmic adenosine triphosphate (ATP) to cyclic adenosine monophosphate (cAMP) (solid curved arrow). Cyclic AMP then stimulates (+) HCN channels. Cyclic AMP also activates (+) PKA (phosphokinase A) that then stimulates (+) CaL channels, SERCA, & RYR2. Cyclic AMP is short-lived because PKA ... that it activated ... activates (+) the enzyme phosphodiesterase (PD) and this will convert cAMP to AMP. In short, cAMP causes it's own demise.
Parasympathetic Division
When the PSNS is the more active than the SNS division, the above described second messengers (cAMP and PKA) will be in short supply. This is because the alphai will be more abundant and will decrease (-) the activity of adenyl cyclase. In addition, the beta/gamma subunits will open acetylcholine-activated potassium channels (KACh) making the overall membrane potential more negative.
Double-click the next section in the Menu.
Heart Rate Modulation
Parasympathetic nervous system (PSNS) activity releases acetylcholine on muscarinic 2 receptors causing them to release beta/gamma dimers & inhibitory alpha subunits. The dimers activate acetylcholine-activated potassium (KACh) channels while the inhibitory alpha subunits decrease activation of adenyl cyclase. Both activities lead to decreased heart rates.
Sympathetic nervous system (SNS) activity releases epinephrine & norepinephrine on beta receptors causing the release of stimulatory alpha subunits. These subunits activate adenyl cyclase that converts ATP to cAMP. Cyclic AMP activates :
- hyperpolarization-activated cyclic nucleotide-gated (HCN) channels
- and phosphokinase A (PKA) that facilitates the activities of:
- calcium (CaL) channels
- ryanodine receptors (RYR2)
- sarcoplasmic reticulum calcium ATPase (SERCA)
- and phospholamban (PL)
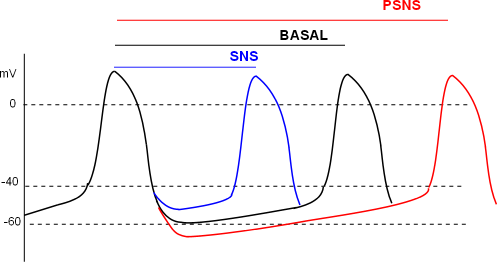
The individual effects of ANS activities on channels and pumps of the pacemaker combine to give the action potential patterns shown here. The relative distance between two action potential 'peaks' for basal, SNS and PSNS conditions are shown by the three lines at the top of the graph. The first peak is used as the reference for all three conditions.
The basal (black) line measures the time between the reference peak and the second black peak; this represents 'normal' heart rate. Under SNS conditions the time between peaks is shortened (blue line) resulting in more beats per minute. Under PSNS conditions the peaks are further apart (red line) resulting in fewer beats per minute.
Responses of Targets Due to SNS Activation
HCN Channels
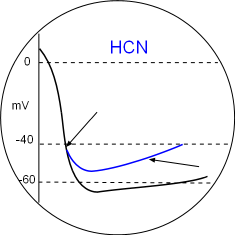
The binding of cyclic AMP to C-terminal receptors on the hyperpolarization-activated cyclic nucleotide-gated channels has two effects. The binding sets the activation potential to a less negative value so that that diastolic depolarization begins sooner (first arrow). The second effect is that the open configuration is facilitated at all potentials causing the diastolic depolarization slope (second arrow) to increase and reach the CaL activation threshold sooner thus increasing heart rate. Locate these in the Model and the graph above.
CaL Channel
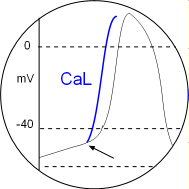
Activated PKA phosphorylates CaL channels setting their activation potential to a more negative value. This is indicated by the arrow in the circular inset. Since each depolarization will begin sooner the distance between peaks will be shortened. Locate this in the Model and the graph above.
RYR2
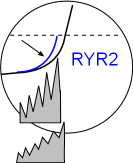
Phosphorylation of RYR2 channels facilitates larger local calcium releases so that the sodium calcium exchangers work at a faster rate as shown by the increase in the exponential shape of the curve. The result is that the CaL threshold will be reached sooner thus increasing the heart rate. Locate this in the Model and the graph above.
SERCA & PL
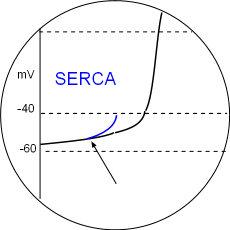
Phosphorylation of SERCA enzymes increases the rate at which the sarcoplasmic reticulum is refilled so that the threshold of calcium ion concentration in the junctional SR is reached more quickly. Phospholamban (PL) phosphorylation removes the inhibitory effect of this protein also facilitates filling. Local calcium releases (LCRs) begin sooner during diastolic depolarization as indicated by the arrow in the illustration. Accordingly, the CaL activation threshold will be reached sooner thus increasing heart rate. Locate this in the Model and the graph above.
Responses of Targets Due to PSNS Activation
KACh Channels
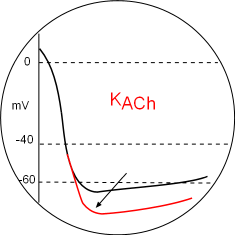
Parasympathetic (PSNS) effects will decrease all of the above effects due to the alpha inhibitory subunit inhibition (-) of adenyl cyclase.
However, the most obvious effect on the action potential graph is due to hyperpolarize the membrane (arrow) by the opening of acetylcholine-activated potassium channels. This is mediated by beta/gamma dimers released from activated muscarinic 2 receptors. These dimers bind to the C-terminals of the channel thus opening it. The greater loss of potassium ions lowers the mean diastolic potential so that it will take more time to reach the CaL activation threshold thus decreasing the heart rate. Locate this in the Model and the graph above.