Electrophysiology Tutorial
There is no single model for this tutorial. You will find several individual models throughout similar to the one shown here.
Study the topics in the order shown in the Menu.
Overview
Voltage-gated Channels
There is no 'Model' for this Tutorial. This tutorial provides important information that is needed to understand the Cardiac Pacemaker Tutorial.
These long proteins pass back and forth through membranes like sewing a buttonhole in a piece of cloth. The 'opening in the button hole' forms a pore with gates that open and close it. Activation gates move in response to the charge difference across the membrane (membrane potential) while inactivation gates are usually time-dependent or dependent on movement of the activation gates.
Activation gates are positively charged sections of the channel that are pulled toward the inner-membrane surface by the negative charge of the cytoplasm along that surface; the pore is closed when it is in this position. If the cytoplasm starts becoming less negative, it cannot 'keep its grip' on the gate and it starts randomly shifting back and forth between the two membrane surfaces. This gate will remain open when the cytoplasm is not sufficiently negative to hold it down.
Inactivation gates are normally open but will usually close after the activation gate has been open for a specific length of time. The activation gate will close during the time the inactivation gate is also closed. During this time the channel is said to be refractory. The inactivation gate must reopen before the activation gate can open again.
Gradients
The kinetic energy of ions is one of two driving forces that move ions through open channels; the other force is electrical. The side of an open channel that has the greater number of ions colliding with it will establish the overall direction of ion diffusion. Additionally, the direction of movement through a pore depends on the ion's charge relative to the charge on each side of the membrane.
Currents
A current is the number of charges that pass a given point in a unit of time. Thus the more charges an ion carries and the faster they are moving ... due to their electrochemical gradients ... the greater the current will be.
Membrane Potentials
A potential is the difference in charges between the inner and outer surfaces of a membrane as recorded at the inner surface; it is measured in millivolts.
- Resting ... the unchanging inner-membrane-surface charge when opposing currents passing through the membrane are equal.
- Action ... the changing inner-membrane-surface charge when opposing currents passing through the membrane are unequal.
- Equilibrium ... a specific membrane potential for each type of ion at which it's influx and efflux are equal.
Current/Voltage Relationship
The amount of current depends on two things: the probability of the channels being open and the electrochemical gradient. As the membrane potential (voltage) becomes more positive additional channels open and stay open longer; there is a membrane potential value that corresponds to 100% probability of channels being open and this yields the maximum possible current. As positive ions enter (or leave) the cell the side from which they leave becomes less positive while the other side becomes more positive. Accordingly, if they are leaving the cell the electrical force (charge on ions) repelling them decreases causing a corresponding decrease in the current.
Action Potentials
Changes in the membrane potential over time are due to simultaneous openings and closings of multiple channels; positive ions can be leaving while different positive ions are entering. The simultaneous movements of these ions establishes the changing potential values seen as action potentials.
Channels
The activities of voltage-gated channels determine the responses of excitable tissues throughout the body. This tutorial focuses on describing the structure and function of various membrane channels involved in the behavior of these tissues. This tutorial is 'required reading' for the following tutorials on the cardiac pacemaker and heart contractility.
Structure
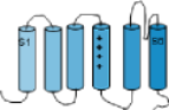 Channels are composed of large membrane-embedded proteins. These long proteins make six passes through the cell
membrane coiling into alpha helices as they do so. In these tutorials these alpha helices are represented as solid
cylinders. The helices are referred to as the 'transmembrane domain' while the sections beyond the membrane are called
'linkers'. The helices are numbered S1 through S6. The illustration to the left shows
the protein in a stretched-out arrangement. The S4 helix is unique because it has a series of positive charges along
its length. Another unique feature is that the linker between S5 and S6, that is at the outer membrane surface, forms
a hairpin-shaped loop that hangs down between S5 and S6.
Channels are composed of large membrane-embedded proteins. These long proteins make six passes through the cell
membrane coiling into alpha helices as they do so. In these tutorials these alpha helices are represented as solid
cylinders. The helices are referred to as the 'transmembrane domain' while the sections beyond the membrane are called
'linkers'. The helices are numbered S1 through S6. The illustration to the left shows
the protein in a stretched-out arrangement. The S4 helix is unique because it has a series of positive charges along
its length. Another unique feature is that the linker between S5 and S6, that is at the outer membrane surface, forms
a hairpin-shaped loop that hangs down between S5 and S6.
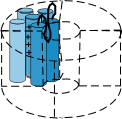 Voltage-gated channels are composed of four such proteins arranged in a circle so that there is a 'pore' between them as shown
to the right. Notice that the S5-S6 linker, also called the P loop, hangs into the pore. This loop is part of the 'selectivity
filter' at the outer mouth of the pore; there are four such loops in all. The S4 helix is called the 'sensor' and, depending
on the charges at the inner and outer membrane surfaces, will moves back and forth within the membrane.
Voltage-gated channels are composed of four such proteins arranged in a circle so that there is a 'pore' between them as shown
to the right. Notice that the S5-S6 linker, also called the P loop, hangs into the pore. This loop is part of the 'selectivity
filter' at the outer mouth of the pore; there are four such loops in all. The S4 helix is called the 'sensor' and, depending
on the charges at the inner and outer membrane surfaces, will moves back and forth within the membrane.
Gates
There are usually two gates associated with these channels. One is called the 'activation gate' and, when it opens (activation), ions can flow through the pore within the channel. The other is called the 'inactivation gate' and, when it closes (inactivation), the pore is closed off stopping the flow of ions. The flow of ions will also stop if the activation gate closes (deactivation) before the inactivation gate closes.
Activation Gate
 The illustration to
the left shows the S6 helix of one of the proteins facing the pore that is at the right. Depending on the
particular channel under discussion, these helices can move in various ways to either open or close the pore they are
facing. All four S6 helices form the activation gate. 'Activation' occurs when these helices, of all four proteins, move so as
to open the pore and 'deactivation' is when they are positioned so as to obstruct the pore.
The illustrations at the left show how the movements of activation gate helices might be visualized.
The illustration to
the left shows the S6 helix of one of the proteins facing the pore that is at the right. Depending on the
particular channel under discussion, these helices can move in various ways to either open or close the pore they are
facing. All four S6 helices form the activation gate. 'Activation' occurs when these helices, of all four proteins, move so as
to open the pore and 'deactivation' is when they are positioned so as to obstruct the pore.
The illustrations at the left show how the movements of activation gate helices might be visualized.
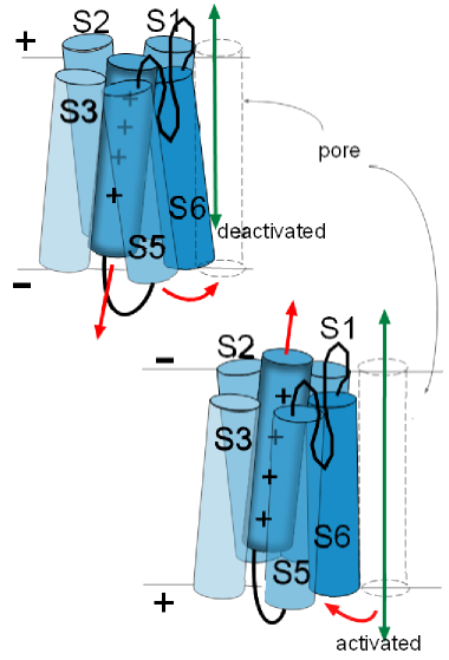
These movements of the activation gate helices occur because of the movement of the associated S4 helix. Being positively charged, an S4 helix is attracted toward the negative inner surface of the membrane. However, depending on the channel being discussed, there is a certain amount of negative charge required to 'hold it firmly' to that side. In the top left illustration the red arrow of the S4 helix indicates it is attracted toward the negative inner surface of the membrane. The curved red arrow how the S6 helix is moved as a result.
In the lower illustration, the charge at the inner membrane surface has become less negative losing its 'hold' on the S4 helix so that it moves (straight red arrow) toward the outer surface. The curved red arrow shows how the S6 helix is 'pulled' out of the pore because of the connections between these helices. The channel will be activated when the last of the four domains moves its S6 helix out of the pore .
Inactivation Gates
Inactivation gates block the openings of the pore; this usually occurs after activation (open channel inactivation) has occurred but can also occur even when the activation gate is closed (closed channel inactivation). These gates are distinct from the above described helices. The blockage can occur at either end or the pore though the more common ... and faster ... blockage occurs at the cytoplasmic opening. Inactivation is when the pore has been closed by this gate and removal of inactivation is when the gate has been removed from the opening of the pore.
...at the cytoplasmic opening
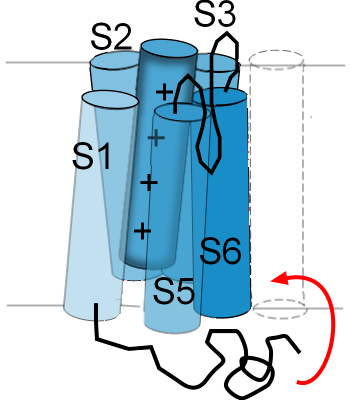 The illustration to the right is an example of how one type of channel inactivates. There is
a twisted black line attached to the cytoplasmic side of S1. This represents
one end of the membrane-embedded protein; it is called the 'N-terminal end'. The curved red arrow shows that,
when the S5-S6 helices are in the 'activated' position ... pulled out of the pore ... the N-terminal end will
move up into the mouth of the pore. As long as the helices are in the 'activated' position this end of the
protein will remain 'latched' in this position where it obstructs the flow of ions through the pore.
The illustration to the right is an example of how one type of channel inactivates. There is
a twisted black line attached to the cytoplasmic side of S1. This represents
one end of the membrane-embedded protein; it is called the 'N-terminal end'. The curved red arrow shows that,
when the S5-S6 helices are in the 'activated' position ... pulled out of the pore ... the N-terminal end will
move up into the mouth of the pore. As long as the helices are in the 'activated' position this end of the
protein will remain 'latched' in this position where it obstructs the flow of ions through the pore.
This type of inactivation gate was the first discovered and has been referred to as a 'ball-and-chain'; the 'ball' is the twisted portion near the end of the 'chain'. There are other ways in which the inner opening of the pore can be blocked but this is the example most often used to illustrate this type of gating behavior.
...at the external opening
 The linker between S5 and S6 functions as a selectivity filter and determines which ions can pass through
the pore. Its structure resembles a hairpin loop that hangs part way down into the pore. Accordingly, it is
often referred to as a P-loop.
The linker between S5 and S6 functions as a selectivity filter and determines which ions can pass through
the pore. Its structure resembles a hairpin loop that hangs part way down into the pore. Accordingly, it is
often referred to as a P-loop.
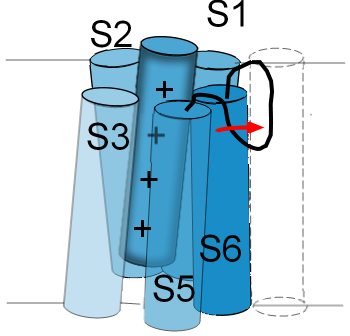
The illustration to the left shows the P-loop stretched out into the opening of the pore as indicated by the red arrow. The normal position for this loop is shown in the previous illustration. If the P-loop moves in this manner it will 'collapse' the pore and obstruct the passage of ions. Not all channels have this type of inactivation gate. Some channels even have inactivation gates at both pore openings.
Activation
Whether an activation gate is open or closed depends on which surface of the membrane is the more negative of the two and whether or not the negativity is sufficient to attract, and hold, the positively charged S4 helices of the activation gate. As that surface becomes relatively less negative, its hold on these helices weakens and they tend to migrate toward the opposite surface. There is evidence that the four individual S4 helices move back and forth independently of one another; all four must simultaneously be at the outer surface for the pore to be open and allow ions to diffuse through it.
Patch-Clamp Experiments
To study channels, a small section of cell membrane ... with only a single channel in it ... needs to be isolated. To accomplish this, the tip of an ultra narrow pipette is held, by suction, over a single channel on the surface (patch) of a cell membrane. Electronic equipment is designed that can control the charge at the inner and outer membrane surfaces. When the negativity at the inner-membrane surface is held (clamped) to a specific value allowing activation gates to open, the flow of ions through these channels can be measured.
The following experiments indicate the charge that is 'clamped' at the inner-membrane surface; it is recorded in millivolts (mV). A large negative value indicates the inner surface is very negative relative to the outer surface. The value at the inner surface can be positive indicating that the outer surface is the more negative of the two. The recordings are very fast (milliseconds) and show when, and for how long, a channels is open and allowing ions to flow through its pore.
Opening is Random
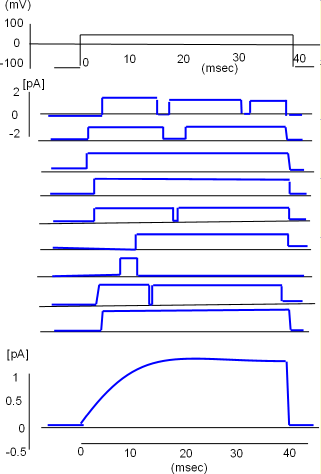 At the top of the llustration to the right is a graph of the procedure (protocol) that was followed to obtain nine recordings from a single potassium
channel. Initially, the charge at the
inner-membrane surface was set at -100 mV which was sufficiently negative to hold the S4 helices down thus closing the channel.
Then the negativity was greatly decreased to +50 mV, sufficient to pull all S4 helices toward the outer surface, and held there for 40 milliseconds before
being returned to -100mV.
At the top of the llustration to the right is a graph of the procedure (protocol) that was followed to obtain nine recordings from a single potassium
channel. Initially, the charge at the
inner-membrane surface was set at -100 mV which was sufficiently negative to hold the S4 helices down thus closing the channel.
Then the negativity was greatly decreased to +50 mV, sufficient to pull all S4 helices toward the outer surface, and held there for 40 milliseconds before
being returned to -100mV.
Just to the left of the first recording is a small scale that goes from +2 to -2 picoamps (measure of the amount of current). The recording pen moved up when the channel was open and returned to baseline when the channel was closed. A close inspection of each channel shows it did not respond the same way each time it was subjected to the protocol. The channel did not always open immediately nor did it open the same number of times or stay open the same length of time. The openings were random.
Although the channel did not always behave the same way each time, the average of its individual recordings gives a good indication of how the current would appear if multiple channels respond simultaneously. This is illustrated by the graph below the individual recordings. Notice the current increases gradually before stabilizing. The slow beginning is a result of not all channels initially opening at the same time. Also note that the current continues to flow as long as the inner-membrane charge is held at +50mV but abruptly stops as the S4 helices are pulled toward the inner surface when the charge is returned to -100mV.
Voltage Dependence
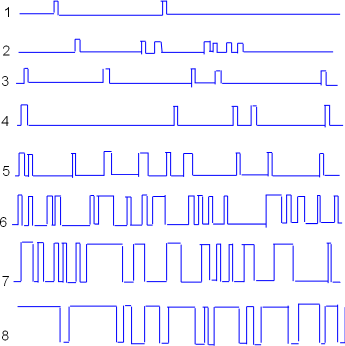 Similar patch-clamp experiments can be performed to determine the effect of clamping to different inner-membrane
voltages. Samples of such recordings are shown to the left. The voltage settings were gradually made less negative
going from recording #1 through recording #8.
Similar patch-clamp experiments can be performed to determine the effect of clamping to different inner-membrane
voltages. Samples of such recordings are shown to the left. The voltage settings were gradually made less negative
going from recording #1 through recording #8.
 Patch-clamp experiments like these provide information about the probability of channels being open (Po)
when the inner-membrane surface is at various levels of negativity.
It appears that the channel was
open approximately 50% of the time in recording #6 and perhaps 90% of the time in tracing #8. To generalize, there is a low probability
of the channel being open (Po) when the inner-membrane charge is more negative and the open probability
increases as that charge becomes less negative.
Patch-clamp experiments like these provide information about the probability of channels being open (Po)
when the inner-membrane surface is at various levels of negativity.
It appears that the channel was
open approximately 50% of the time in recording #6 and perhaps 90% of the time in tracing #8. To generalize, there is a low probability
of the channel being open (Po) when the inner-membrane charge is more negative and the open probability
increases as that charge becomes less negative.
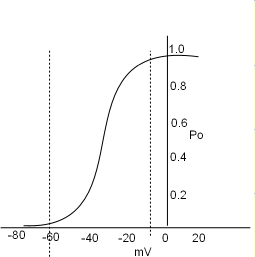
The graph to the right plots open probability (0 to 1 with 1 being 100% probability of being open) against the negativity at the inner-membrane surface (millivolts,mV). This graph shows that the channel in question shows the first sign of a opening at ~-60 (first dotted line) and the channel reaches its maximum open probability at ~-10 (second dotted line).
Inactivation
A channel is closed by two mechanisms. The S4 helices of the activation gate can be pulled back toward the inner-membrane surface by increasing the negativity at that surface; this type of closure is called deactivation. The channel can also be closed by the inactivation gate moving to obstruct the pore; this type of closure is called inactivation and it usually occurs first and deactivation occurs while the channel is still inactivated.
Sodium Channels
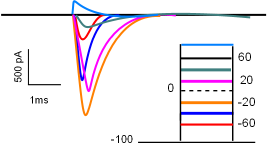
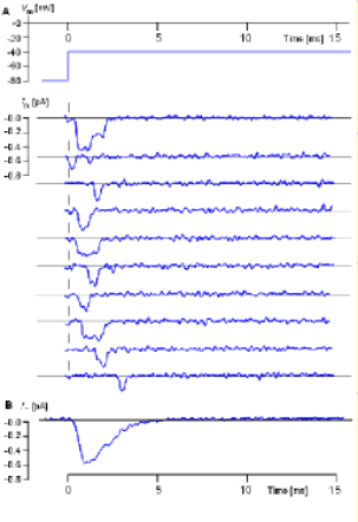 The illustration to the left (From Hille, 1992, as provided by J. B. Patlak; see also Patlak and Ortiz, 1986.) shows actual recordings taken
from single sodium channels. The inward sodium current ... rather than outward as it was for the potassium current ... is shown as
a downward deflection.
Another obvious difference between these recordings, compared to those from the potassium channel described in the previous section, is that the
sodium channel opens only once.
The illustration to the left (From Hille, 1992, as provided by J. B. Patlak; see also Patlak and Ortiz, 1986.) shows actual recordings taken
from single sodium channels. The inward sodium current ... rather than outward as it was for the potassium current ... is shown as
a downward deflection.
Another obvious difference between these recordings, compared to those from the potassium channel described in the previous section, is that the
sodium channel opens only once.
Each recording was performed at the same voltage. The protocol at the top indicates an initial inner-membrane charge of -80mV was 'stepped' to -40mV and held there for 15 milliseconds. The individual recordings show that the channel opened only once, did not always open immediately and did not stay open for the same length of time. An average of many such recordings is shown below the individual examples and indicates how the current would appear if a population of sodium channels was subjected to the same protocol.
This current would reach a maximum quickly before gradually decaying within 5 milliseconds. The decay of the current can not be due to closure of activation gates (deactivation) because that requires that the negativity of the inner-membrane surface be increase rather than maintained at -40mV. Therefore, the current decay must be due to inactivation gates obstructing pore openings. This 'decay' of the current occurs because individual channels remain open for slightly different lengths of time before their pores becomes obstructed.
Removal of Inactivation
 A sodium channel inactivates quickly and is refractory ...cannot be stimulated to reopen ... until its inactivation gate has moved
away from the pore opening. The next protocol is designed to determine how long it takes for all the
sodium channels in a population to recover from inactivation at -70mV.
A sodium channel inactivates quickly and is refractory ...cannot be stimulated to reopen ... until its inactivation gate has moved
away from the pore opening. The next protocol is designed to determine how long it takes for all the
sodium channels in a population to recover from inactivation at -70mV.
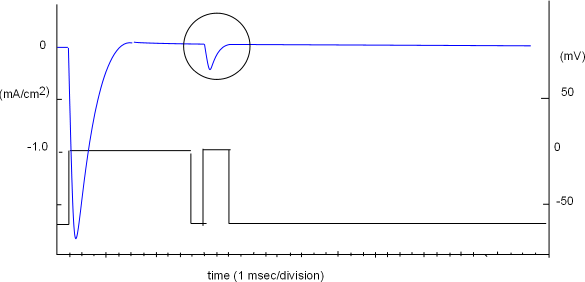
The protocol is shown in the lower part of the graph to the right and the right vertical axis (millivolts, mV) is part of it. The vertical axis to the left (mA/cm2) goes with the current curve (blue) indicating the amount of current per square centimeter of membrane surface; the 'patch' covered by the pipette tip contains a population of sodium channels.
The protocol consists of two voltage steps; the first is a 'conditioning' or 'prepulse' step while the second is a 'test' step. Initially the voltage was set to -70mV and the current curve verified that there was no current ... activation gates were closed. The conditioning step reduced the negativity to zero millivolts ... sufficient to provide a large open probability ... and an inward (-) current of ~1.7mA/cm2 was produced. This current decayed within a few milliseconds even though the voltage was maintained for 10msec. The shape of the current curve is as predicted from the previously described average of individual channel currents.
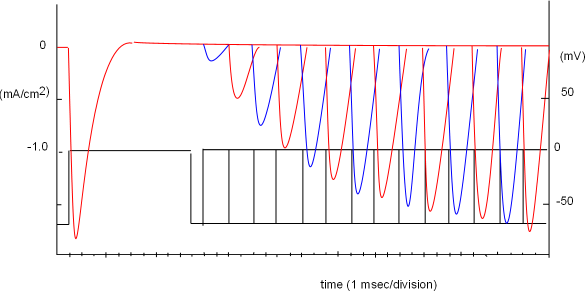 The negativity at the inner-membrane surface was briefly (1 msec) increased back to the original -70mV level in order to close
all activation gates. When the second (test) step decreased
the negativity back to zero mV a small current was produced, as shown within the circle, indicating that at least some of the channels
within the population had recovered from inactivation at this point in time.
The negativity at the inner-membrane surface was briefly (1 msec) increased back to the original -70mV level in order to close
all activation gates. When the second (test) step decreased
the negativity back to zero mV a small current was produced, as shown within the circle, indicating that at least some of the channels
within the population had recovered from inactivation at this point in time.
The graph at the left was obtained when this protocol was repeated thirteen more times but the 'wait time' between the two steps was incrementally increased by 2 milliseconds. Each time, the test current increased until, at the thirteenth test, enough time had passed so that all inactivation gates had moved out of the pores.
All these test curves have been superimposed in the graph; different colors make it easier to differentiate one curve from the next. Note the combined protocols shown in the bottom portion of this graph. The thirteenth test step shows it required 37 msec, after the start of the conditioning step, for all channels to recover from inactivation. Opening of inactivation gates it time-dependent.
Currents
Two factors govern the flow of ions through open channels in a membrane. One factor, the chemical gradient, has to do with the actual number of ions positioned at the inner and outer 'mouth' of the pore of an open channel. The other factor, the electrical driving force, involves electrical attractions and repulsions at these same two locations. If a positive ion, positioned at a mouth of a pore, is surrounded by other positive ions, the tendency will be for it to be 'repelled' through the pore. On the other hand, if that same positive ion is surrounded by negative ions, the tendency will be for it to be 'attracted' toward them and the probability of it passing through the pore will be reduced. Working together, both of these factors influence the flow of ions through open channels.
Currents
A current is the directional flow of charges ... carried by ions in this situation. When a channel is open ions actually flow in both directions but the flow in one direction is usually greater than the flow in the other direction. The net flow, whichever the direction, is referred to as the current. For example, if 100 ions flow in and 25 of the same type ion flow out each millisecond, then the current is the net influx of 75 ions per millisecond. Another example would be 300 ions flowing out per millisecond and 10 flowing in resulting in a net effluxing current at the rate of 290 ions/millisecond.
Current is measured in amperes; this is a measure of the number of charges passing a point each second. One ampere represents more than 6,000 quadrillion charges (6X10¹⁸). But usually microAmps (micro- means millionth (10-6)) or nanoAmps (nano- means billionth (10-9)) are used to describe the magnitude of a current. It's still a big number.
Concentration Gradients
Except at the inner and outer-membrane surfaces, the concentrations of individual ions in the cytoplasm as well as the extracellular fluid remain fairly constant. Physiological concentrations are usually expressed in millimoles/liter (mM/L); a millimole is a thousandth of a mole (1x10-3 X 6.024X1023 = 6.024x10²⁰) ... another large number. Following are the concentrations (mM/L) of the major ions in the cytoplasm and the extracellular fluid (ECF):
- Potassium (K+): 150 cytoplasm/ 4 ECF
- Sodium (Na+): 20 cytoplasm/ 145 ECF
- Calcium (Ca++): 0.0001 cytoplasm/ 2.5 ECF
The difference between concentrations of an ion at the two surfaces of a membrane is called the concentration gradient. These values are important in understanding the overall direction of ion movement through open channels. For example, since there are almost 40X more potassium ions inside the cell than outside, the net flow of these ions will be from inside to outside. The same reasoning holds for sodium; the net flow of sodium ions will be inward because there are ~7X as many of them outside compared to inside. A calcium current will definitely be inward because there are 10,000 more calcium ions outside than inside. Net ion flow is 'down the concentration gradient' (diffusion) from the region of high toward the region of low concentration.
Electrical Driving Force
Since ions are charged particles they will experience electrical attractions and repulsions. On the whole, the cytoplasm and extracellular fluids are electrically neutral. However, this is not the case along the very inner and outer surfaces of the cell membrane due to 'unbalanced' movement of positive ions in and out of the cell.
Assume there is no charge difference between the two surfaces of the membrane. If sodium channels open, the overall movement will be inward ... down the sodium ion concentration gradient. This is a loss of positive charge (Na+) from the outer-membrane surface and a gain of positive charge for the inner-membrane surface. The result is that now there is a charge difference between the two surfaces. This difference is called an electrical gradient and it establishes the electrical driving force that governs the how fast the current flows. As this ion movement continues, the difference in charges will increase with the outer surface becoming increasingly negative and the inner surface becoming increasingly positive.
However, the continued movement of sodium ions down their concentration gradient will begin slowing because their concentration gradient is becoming smaller. In addition, the region they are entering is becoming more positive while the region they are leaving is becoming less positive. An electrical gradient is building. Eventually a point will be reached at which their movement 'down the concentration gradient' will be counterbalanced by the electrical gradient pulling them in the opposite direction. When this occurs, there will no longer be a current because ions will be moving at an equal rate in both directions.
As described above, overall concentrations are essentially unaffected by ion movement through membrane channels. However, the electrical driving force at the membrane surfaces changes constantly due to ion movement through open channels. If positive ions enter the cell the inner-membrane surface becomes more positive (or less negative) while the opposite change is occurring at the outer-membrane surface. If positive ions leave the cell the inner-membrane surface becomes less positive (more negative) while the opposite change is occurring at the outer-membrane surface. The difference in charge between the two surfaces of the membrane is called an electrical gradient. The greater this gradient the greater will be the electrical driving force.
Voltage & Measuring the Electrical Gradient
An electrical gradient, or separation of charges, exists within a battery. The greater this charge separation the greater the 'potential' to create a current between it's positive and negative ends if a path exists. This 'potential' driving force can be measured with a voltmeter whether it exists in a battery or between the two surfaces of a cell membrane.
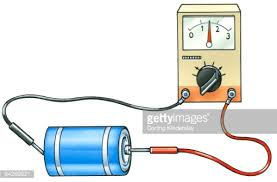 The cell membrane is much like the dividing wall inside a two-cell battery that separates the positive and negative charges. To measure
the extent of this charge separation the electrodes of a voltmeter are held against the exposed metal surfaces of each cell. The illustration
shows a red electrode held to the small nub at one end (the + cell) and the black one to the other end (the - cell). The wire/voltmeter/wire
combination forms a path for negative electrons to travel from the - cell toward the + cell. As this occurs the needle in the voltmeter reflects
the driving force behind this current of electrons. This measure of the electrical driving force is called voltage.
The cell membrane is much like the dividing wall inside a two-cell battery that separates the positive and negative charges. To measure
the extent of this charge separation the electrodes of a voltmeter are held against the exposed metal surfaces of each cell. The illustration
shows a red electrode held to the small nub at one end (the + cell) and the black one to the other end (the - cell). The wire/voltmeter/wire
combination forms a path for negative electrons to travel from the - cell toward the + cell. As this occurs the needle in the voltmeter reflects
the driving force behind this current of electrons. This measure of the electrical driving force is called voltage.
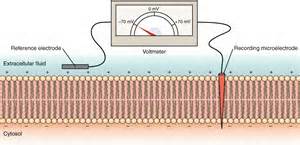 The same technique can be used to measure charge separation across a membrane.
The right illustration shows a membrane with a 'recording' electrode penetrating the cell membrane and a 'reference' electrode held against
its outer surface. The needle on the voltmeter points to -70mV. This indicates the charge 'recorded' at the inner surface is 70mV more
negative than the charge a the outer surface. This membrane has a potential of -70mV.
The same technique can be used to measure charge separation across a membrane.
The right illustration shows a membrane with a 'recording' electrode penetrating the cell membrane and a 'reference' electrode held against
its outer surface. The needle on the voltmeter points to -70mV. This indicates the charge 'recorded' at the inner surface is 70mV more
negative than the charge a the outer surface. This membrane has a potential of -70mV.
Potentials
The membrane potential is the charge at the inner-membrane surface of a cell and takes into account the activities of all movements of ions into and out of the cell. The membrane potential might remain constant over a period of time ... its 'resting' potential. At other times it might be changing over a certain period of time ... an 'action' potential.
An equilibrium potential is a specific membrane potential that will counterbalance the driving force of an ion's concentration gradient thus stopping that ionic current.
Membrane Potentials
Resting Potential
Voltage-gated channels are closed at the resting potential but other activities are moving ions across the membrane affecting the charge at the inner-membrane surface.
- There are potassium ion channels that are not voltage-gated and allow the efflux of potassium ions. This constant loss of positive charge moves the membrane potential in the negative direction. In addition ...
- Sodium-potassium pumps simultaneously move 3 sodium ions (3Na+) out of the cell and 2 potassium ions (2K+) into the cell. This net loss of a positive charge also moves the membrane potential in the negative direction. However ...
- Sodium-calcium exchangers move 3 sodium ions (3Na+) into the cell in exchange for one calcium ion (Ca2+). The net gain of a positive charge moves the membrane potential in the positive direction via this mechanism.
The combined activities of these three mechanisms results is a relatively stable membrane potential of ~-90mV; this is the resting potential of cardiac contractile cells. Each cell type has its own resting potential value.
Action Potential
If positive ions move into the cell (influx) the negativity of the resting potential will become less negative. Change of the membrane potential in this direction is called depolarization. If positive ions move out of the cell (efflux) the membrane potential will become more negative; this is called repolarization. An unstable membrane potential that is depolarizing then repolarizing is called an action potential.
Electrochemical Gradients & Equilibrium Potentials
Concentration Gradients
This concept was described in the Currents Section of this tutorial. The values are repeated here for ease of reference.
- Potassium (K+): 150 cytoplasm/ 4 ECF
- Sodium (Na+): 20 cytoplasm/ 145 ECF
- Calcium (Ca++): 0.0001 cytoplasm / 2.5 ECF
Electrical Gradients
Eventually, a sufficient number of ions will pass through the membrane that the change in electrical charge across the membrane will counterbalance the effects of the concentration gradients. When this point is reached there will be no net current. This membrane potential at this point is called the equilibrium potential and, for the concentration gradients listed above, are as follows:
- The equilibrium potential for potassium is ~-96mV. This force is sufficient to counterbalance the efflux of potassium ions.
- The equilibrium potential for sodium is ~+60mV. This force is sufficient to counterbalance the influx of sodium ions.
- The equilibrium potential for calcium is ~+137mV. This force is sufficient to counterbalance the influx of calcium ions.
Voltage
The previous 'Activation' section described how the voltage-sensing S4 helices of voltage-gated channels move in response to electrical gradients. These helices are positively charged and, like ions diffusing through channels, their movement is affected by this electrical potential across the membrane. In most cases, when these helices are pulled toward the inner-membrane surface, the channel is closed; when they are toward the outer surface the channel is open. But what are the membrane potentials values that enable a minimal current, a maximum current and at what potential will the current stop? These values will be unique for each type of channel.
The resting membrane potential of cardiac muscles (-90mV) keeps the S4 helices of all types of voltage-gated channels attracted to the inner surface so that none of these channels are open. However, as this value become less negative, this attraction will weaken and the S4 helices will begin shifting to open the channels. Regardless of how many channels are open at any instant at a given membrane potential, a current will flow until an equilibrium potential is reached where the outward and inward driving forces counterbalance each other.
Current
Measurement at Different Voltages
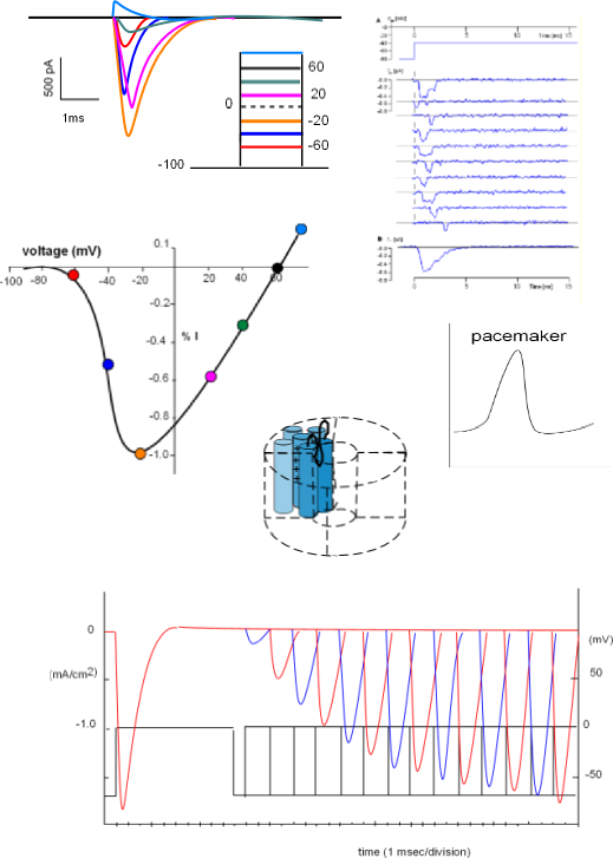
The current/time graph and protocol (looks like a ladder) show a series of sodium currents that occurred at several different membrane potentials. The protocol shows a 'holding' (initial) potential of -100mV ... all sodium channels closed ... that is 'stepped' and clamped to less negative potentials for a few milliseconds.
The graph indicates that no current occurred when the membrane potential was held at -100mV (straight black line) but when the potential was stepped to -60mV (red line) a small inward current occurred (red curve). The second test stepped the potential from -100mV to -40mV (blue line); the current produced (blue) was greater than before. The current was increased yet again when the step went to -20mV (orange line).
However, with further depolarizations, the current progressively becomes smaller (fuschia and green curves). At +60mV there was no current at all ... straight black line . And, when the potential was stepped a more positive potential (light blue line and curve), an outward, rather than an inward, current was generated. (Recall that, in current/time curves, downward deflections represent inward currents and upward deflections represent outward currents.)
The lack of current at 60mV indicates that this value was the equilibrium potential for sodium ions at the internal and external concentrations used in this experiment. The fact that the direction of current reversed at membrane potentials positive to the equilibrium potential indicates that the electrical driving force now exceeds that of the concentration gradient. For this reason, an ion's equilibrium potential is often called its reversal potential.
Balancing Act Between Two Driving Forces
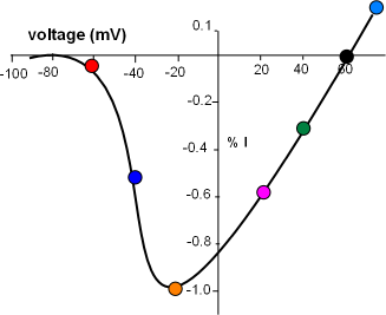
The current/voltage graph for the above series of curves is shown to the left. Voltage (mV) is on the horizontal axis
running from -100 to just greater than 60mV. Current (I) is on the centrally located vertical axis; positive values indicate an outward
current while negative values indicate an inward current.
The greatest peak current is set to be equivalent to -1.0 (orange circle) with the others plotted relative to this.
Each colored circle was plotted using the data from the above series of graphs.
There is no current at the 60mV equilibrium potential where the curve crosses the horizontal axis and, more positive to that value, the current reverses direction. At the other end of the graph the lack of current at values more negative than -70mV indicates that no sodium channels are open. A small current (red circle) reflects the low open probability at this 'activation threshold'. The current doubles at -40mV quickly reaching a maximum at -20mV. This rapid increase is due to the increasing open probability of the channels as the decreasing negativity at the inner-membrane surface weakens its 'hold' on the S4 helices of the activation gates.
With the channels now fully opened the effect of the continuing influx of positive charge can be seen. As positive sodium ions continue to accumulate at the inner-membrane surface their repulsion of the additional influx of sodium ions increases thus slowing down this current even further. By 40mV the current has decreased to 30% of maximum and completely stops at the equilibrium potential. At this potential the inward (concentration) driving force is equal to the outward (electrical) driving force.
Action Potentials
An action potential occurs when the membrane potential of a cell depolarizes then repolarizes. This is set in motion by a stimulus, either internal or external to the cell, causing various ion channels to open and close allowing ions to briefly enter and exit the cell. The first phase of the action potential (depolarization) is when positive ions influx more rapidly than they eflux; the second phase (repolarization) is when positive ions efflux more rapidly.
Influxing & Effluxing Currents
Resting potentials are negative, as described in a previous section on Potentials, and something must 'stimulate' the cell membrane to stop 'resting' and exhibit an 'action potential'. Whatever the actual 'stimulus', the membrane must depolarize sufficiently to reach the activation threshold of a population of channels that permits positive ions to enter the cell. The initially small open probability of these channels will increase due to the depolarizing effect that influxing positive ions have on the membrane potential. As the membrane potential continues to depolarize, the activation thresholds of other populations of channels will be reached and the motion of those ions will exert their effects on the membrane potential.
Simultaneous Currents
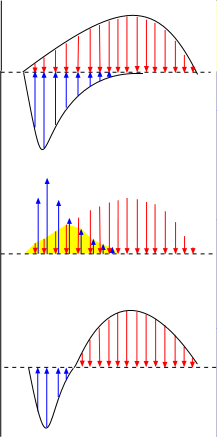 The top graph to the right shows two curves; the one below the line is an influxing current and the one above the
line is an effluxing current. The arrows within the curves are vector arrows that indicate the strength and direction
of the currents over time.
The top graph to the right shows two curves; the one below the line is an influxing current and the one above the
line is an effluxing current. The arrows within the curves are vector arrows that indicate the strength and direction
of the currents over time.
The overall current that results from both these currents occurring simultaneously can be determined as shown in the middle illustration.
- The blue current arrows are moved up beside the red arrows .
- The sections where the paired red and blue arrows cancel each other are eliminated (yellow background).
- The remaining blue arrows are returned to their original position below the baseline.
- The remaining red arrows are brought down to touch the baseline.
The third illustration shows the combined currents. As shown in the top illustration, there is an influxing current (blue) during the first half of the time period while an effluxing current (red) continues the entire time. The combined currents give an initial short-lived bell-shaped influxing current followed by a bell-shaped effluxing current that lasts twice as long.
Currents & Membrane Potentials
 The previous graphs show a vector representation of current as a function of time. But
action potential graphs show the membrane potential as a function of time. This would require converting the currents from the
last graph in the above series to membrane potentials.
The previous graphs show a vector representation of current as a function of time. But
action potential graphs show the membrane potential as a function of time. This would require converting the currents from the
last graph in the above series to membrane potentials.
We can approximate this by using the vector arrows from the last graph given the following facts:
- The upward-pointing blue arrows represent the influx of positive charges that would cause depolarization.
- The downward-pointing red arrows represent the efflux of positive charges that would cause repolarization.
- The length of each arrow represents a relative amount of current so that a 10mm line would represent twice as much current as a 5mm line.
- Currents are additive; the amount of positive charge moved across the membrane is added to that which has already accumulated.
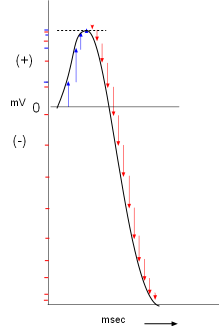
As shown to the right, a membrane potential scale (millivolts, mV) is drawn on the Y-axis with time (milliseconds, msec) on the X-axis. A horizontal line is drawn at 0mV that will be used as an arbitrary starting point. The first arrow from the final graph is positioned close to the beginning of this line. It indicates a small inward positive current that would slightly increase the membrane potential (small blue mark on the Y-axis opposite the arrowhead) from it's starting value of 0mV.
The next arrow is added a short distance to the right of the first (a millisecond has passed) so that it starts where the previous arrow left off (the charges accumulate). The membrane potential is more positive as shown by the corresponding blue mark on the Y-axis. The remaining two blue arrows are added in like manner but these small currents did not increase the membrane potential too much.
The repolarizing (red) arrows are added after the blue arrows following the same procedure. Notice the red marks on the Y-axis that correspond to each arrow. During this repolarizing current the membrane potential fell rather sharply into the negative range. The line connecting the arrowheads resembles an action potential graph.
Action Potentials
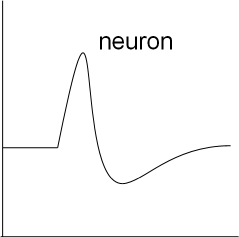 This is a graph showing the basic shape of a neuron action potential. Notice the initial horizontal (resting) membrane potential
followed by a depolarizing then a repolarizing section. The repolarization goes below the level of the initial resting potential
before slowly returning to that level.
This is a graph showing the basic shape of a neuron action potential. Notice the initial horizontal (resting) membrane potential
followed by a depolarizing then a repolarizing section. The repolarization goes below the level of the initial resting potential
before slowly returning to that level.
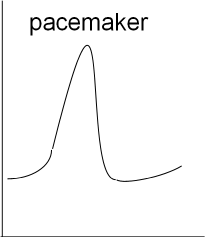 Next is a graph showing the basic shape of a cardiac pacemaker action potential. The depolarization and repolarization is similar to
that of the neuron but there is no resting potential (flat, horizontal line). Instead, immediately following repolarization the
membrane potential begins a slow depolarization that will initiate another rapid depolarization.
Next is a graph showing the basic shape of a cardiac pacemaker action potential. The depolarization and repolarization is similar to
that of the neuron but there is no resting potential (flat, horizontal line). Instead, immediately following repolarization the
membrane potential begins a slow depolarization that will initiate another rapid depolarization.
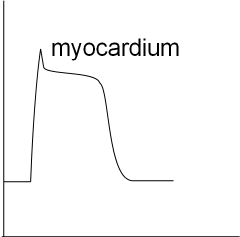 The last graph shows the basic shape of a myocardial action potential. There is a resting potential and a rapid depolarization that
is followed by a brief repolarization that levels out to a plateau. During the plateau influxing and effluxing currents are equal.
This is followed by repolarization back to the resting potential.
The last graph shows the basic shape of a myocardial action potential. There is a resting potential and a rapid depolarization that
is followed by a brief repolarization that levels out to a plateau. During the plateau influxing and effluxing currents are equal.
This is followed by repolarization back to the resting potential.