Phases
 The action potential has been described
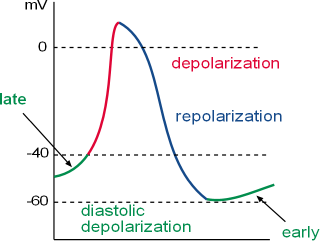
in several ways. Typically, the steep up (depolarization) and down (repolarizaton) sections of the graph have been called
the action potential with the more gradual incline between these sections called the prepotential or pacemaker potential.
It is now more common to refer to the entire graph as the action potential and to divide it into sections called diastolic depolarization (former
prepotential), depolarization and repolarization.
The action potential has been described
in several ways. Typically, the steep up (depolarization) and down (repolarizaton) sections of the graph have been called
the action potential with the more gradual incline between these sections called the prepotential or pacemaker potential.
It is now more common to refer to the entire graph as the action potential and to divide it into sections called diastolic depolarization (former
prepotential), depolarization and repolarization.
The reason the pacemaker is 'automatic' ... action potentials occurring one after the other ... has to do with the presence of
voltage-activated channels in the membranes of these cells. This set of tutorials leads the reader through the behavior of each
type of channel and how each affects the next channel. The inward and outward diffusion of positive ions through these channels
produces the repetitive action potentials characteristic of the cardiac pacemaker.
The concepts involved have been presented in the tutorial called Channels & Currents and
should be studied before continuing with this series of tutorials.
Some Terminology
The three sections of the pacemaker action potential are labeled and color coded on the graph.
The y-axis of the graph shows the membrane potential in millivolts (mV) and the x-axis is time. Accordingly, the graph depicts
how the membrane potential changes over time. Depolarization is also called phase 0, repolarization is called phase 3 and
diastolic depolarization is called phase 4. These numbers are taken from similar phases in the action potential of
contracting heart cells ... they also have a phase 1 and 2 not found in the pacemaker action potential.
The term 'action potential' means that the membrane potential is not stable but is changing, i.e., action. As described in
the Channels & Currents tutorial, the 'membrane potential' is the charge, in millivolts (mV), at the inner-membrane surface, relative to
the charge at the outer surface. When the inner charge is negative the membrane is said to be 'polarized'. When the charge is becoming less
negative it is 'depolarizing' and when it is becoming more negative again it is 'repolarizing'. The term hyperpolarization
is frequently encountered; it means the membrane potential is more (hyper-) negative than usual. The term 'diastolic'
refers to the time between contractions when the heart is relaxing.
It is the flow of positive ions in and out of the cell, through the membrane, that causes the membrane potential to change.
Positive ions flowing inward (influxing) make the charge at the inner surface less negative ... the membrane is depolarizing.
Positive ions flowing outward (effluxing) make the charge at the inner surface more negative ... the membrane is repolarizing.
Heart Rate
The accumulation of positive charges at the action potential peak establishes a temporary gradient
for these ions to diffuse through gap junctions into adjacent cells. This influx of positive charge causes the 'recipient' cell
to depolarize ... producing its own 'peak' ... so that the next cell, and the next, and the next also depolarize.
This wave of depolarization eventually reaches the contractile cells. Depolarization of contractile cells causes them to
contract but they also allow positive ions to diffuse through their gap junctions to surrounding contractile cells, etc., etc., etc.
So, the more rapidly pacemaker cells can produce 'peaks' the more rapidly the heart will contract.
Updated:2/14/2016
Continue to Depolarization
Return to previous tutorial... Description of Diagram
Return to home page