Cardiovascular Tutorial
Click on 'Model' in the menu to the left to view this at any time. The model depicts the interrelationships between the major topics of this tutorial. Click on "Design" in the Menu to the left.
This system consists of the heart and the blood vessels. Vessels that carry blood away from the heart are called arteries and those that carry blood toward the heart are called veins. Capillaries, short, thin-walled vessels, lie within the various organs and connect arteries to veins.
Design of the Model
Direct and inverse cause-and-effect relationships are illustrated as follows:
Anatomical Design
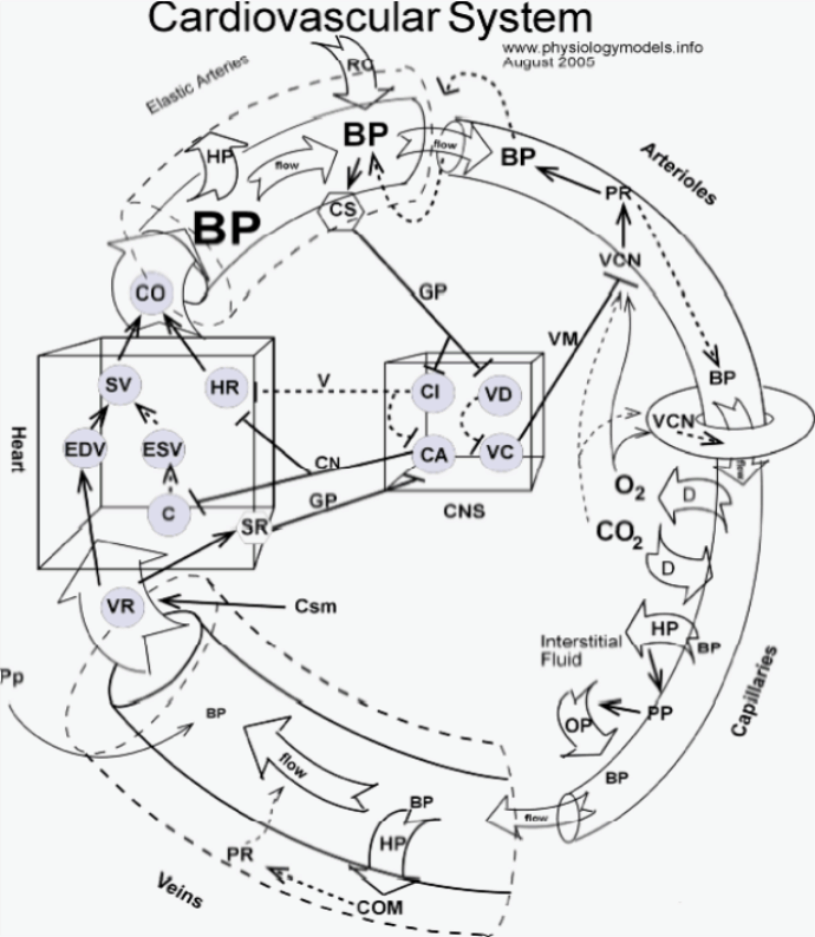
The cardiovascular system consists of the heart (box at left) and blood vessels. Vessels leaving the heart are called arteries (curved tube at upper left corner) which give rise to smaller vessels called arterioles (curved tube at upper right corner). These give rise to capillaries (lower right corner) that recombine to form veins (lower left corner) which return blood to the heart.
The central nervous system (box in center) has two cardiac centers (CA and CI circles) and two centers that control blood vessels (VI and VD circles). Nerves (solid and dashed lines) enter and leave the central nervous system.
Interstitial fluid that surrounds tissues is represented as the area inside the circle of vessels beside the capillary.
The block arrow (top of heart box) represents blood flowing from the heart into the arterial system; CO is cardiac output, the volume of blood leaving the heart each minute. The block arrow (bottom of heart box) represents blood flowing from the venous system into the heart; VR is venous return, the volume of blood returning to the heart each minute. The block arrows along the vessels represent the flow of blood along its pressure gradient. The donut structure at the beginning of the capillary represents the precapillary sphincter muscles that open and close to regulate the flow of blood into capillary beds.
Heart
Cardiac Output and Blood Pressure
This tutorial describes the function of the left ventricle. Over the course of one minute a volume of blood called the cardiac output (CO) is forcefully ejected into the aorta. The pressure of this blood on the wall of the aorta is blood pressure (BP) ... specifically, systolic pressure. The greater the cardiac output the greater the pressure will be.
The insert shows the ventricle (box), the aorta leaving at the top, the return of blood at the bottom. Three nerves are shown at the right side of the ventricle; these will be described in the "Cardiac Centers' section.
The grey circles represent important features that control the cardiac output and therefore the blood pressure. These are:
Factors Controlling Cardiac Output
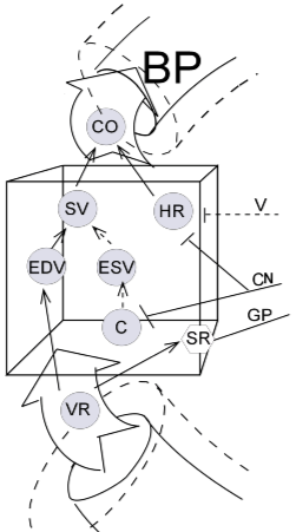
The two two main factors that control cardiac output (CO) are stroke volume (SV) and heart rate (HR). The solid black arrows pointing from each of these toward cardiac output (CO) indicate that these are direct relationships; an increase in either stroke volume and/or heart rate will increase the cardiac output ... and vice versa.
Heart Rate (HR)
The cardiac pacemaker has an intrinsic rhythm that can be modified by nerves originating in the brain. These are shown in the inset as a dashed line (vagus nerve, V) and a solid line (cardiac nerve, CN). Increased input from the vagus nerve will decrease the heart rate (inverse relationship) while increased input from the cardiac nerve (CN) will increase the heart rate (direct relationship). This will be covered later in more detail in the 'Cardiac Centers' section of this tutorial.
Stroke Volume
Venous return (VR) and End Diastolic Volume (EDV)
Starling's Law of the Heart states, "the more the heart muscle is stretched while it is filling, the more forcefully it will contract". This is an intrinsic behavior of cardiac muscle cells. How much the ventricle fills, stretching the cardiac muscle cells, depends on how long the ventricle rests before the next signal from the pacemaker. The volume of blood in the ventricle just before it contracts is called the (end diastolic volume (EDV). Diastole mean relaxation of the heart. The relationship between EDV and SV is direct as represented by the solid arrow; the greater the EDV the greater the SV and vice versa.
The insert also indicates a direct relationship between the venous return (VR) and EDV (solid arrow). If more blood is returned to the ventricle over the course of one minute then there will be more blood ejected from the ventricle with each beat during that minute.
Contractility (C) and End Systolic Volume (ESV)
The strength with which cardiac muscle cells contract is called contractility (C). This is regulated by impulses from the vagus nerve (V) from cardiac centers in the brain. The degree to which these cells contract governs how fully the ventricle is emptied with each beat.
As the ventricle contracts, it compresses the blood pushing its components closer together and increasing molecular motion, thus increasing the blood pressure. This increasing pressure forces blood into the cusps of the mitral valve thus blocking additional blood from entering the left ventricle. The tricuspid aortic valve simultaneously opens as the tension of its 'heart strings' (chordae tendineae) decreases as the walls move inward and upward during contraction.
The volume remaining in the ventricle at the end of a contraction is called the end systolic volume (ESV) -- systole means contraction. If contractility is high a greater proportion of the ventricular blood will be ejected and a smaller proportion will remain behind in the ventricle (EDV). This inverse relationship is represented by the dashed arrow between C and ESV.
Blood flows away from the heart through a series of vessels that branch off and become smaller as they head toward beds of capillaries throughout the body. The structure of these vessel walls changes along the way. Early vessels like the aorta mainly consist of elastic fibers allowing pulsation as they expand and relax with each surge of blood through them. Further downstream, smaller vessels have fewer elastic fibers and increasing encircling smooth muscle cells. The walls of these smaller vessels lose their ability to stretch and recoil but gain neural control of their diameters. Capillary beds, branching from these, are not controlled by nerves but open and close in response to dissolved respiratory gasses -- oxygen and carbon dioxide.
Arteries
As blood flows through the various vessels of the circulatory system its pressure drops because of frictional resistance at the inner vessel surface. This means the pressure nearest the heart will be greater than that further down the line -- this is called a pressure gradient -- and blood will flow from the greater to the lower pressure.
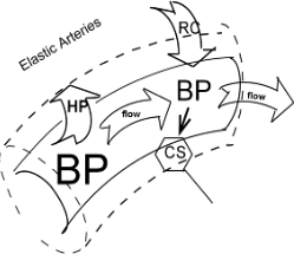
The insert shows highly-pressurized blood ejected from the left ventricle stretches the walls of the elastic aorta increasing its diameter (as implied by the dashed outline of the vessel). Since blood is mostly water this expansion (shown by the large arrow from BP to the expanded wall) is said to be due to hydrostatic pressure (HP). The resulting increased volume of the aorta 'tempers' the pressure so the ejection is not too 'explosive'.
Flow
Flow is defined as the movement along a pressure gradient, that is, from a region of high pressure toward a region of lower pressure. The downstream blood pressure is lower than the aortic pressure enabling blood to flow away from the heart. As aortic pressure drops the stretched aortic walls will recoil (RC arrow) back to their unstretched state.
The carotid arteries are early branches off the aorta and carry blood toward the brain. Within these walls are clusters of neurons called carotid sinuses (CS). Transmission of impulses to cardiac centers in the brain increases as blood pressure in this location increases and vice versa. This direct relationship is shown as the solid arrow between BP and CS. The implications of this neural connection will be described in the "Cardiac Centers" section.
Arterioles
Blood flow through vessels is dependent on a pressure gradient; this gradient is dependent on peripheral resistance which, in turn, is dependent on the extent of vasoconstriction of the vessel wall. As blood flows down its pressure gradient a portion of it 'scrapes' against the inner surface of the vessel. This friction decreases blood flow and is referred to as peripheral resistance. The smaller the vessel the greater the portion of blood that encounters this friction and the more rapidly the blood pressure decreases.

Pressure Gradient
In the insert, flow is depicted as the labeled flow arrow between a large and small vessels ... lower downstream pressure is denoted by the smaller size of the BP letters. If this downstream blood pressure increases ... for whatever reason ... the flow into this vessel will decrease; this inverse relationship is represented by the dashed arrow between the two. Following this, the decreased flow will increase the blood pressure leading into this area; another inverse relationship. This 'double negative' relationship maintains a pressure gradient to keep the blood flowing.
Peripheral Resistance
The diameter of a vessel is the determining factor in how rapidly the pressure will drop as well as the rate of flow within that vessel. In blood flowing through a narrow vessel a large portion of it is in contact with the vessel's wall and loses energy through friction. This 'drag' along the vessel wall is peripheral resistance (PR). The energy loss is the principle reason blood pressure drops as flow continues through the vessel.
The insert shows this situation. Peripheral resistance (PR) shown in the center of the arteriole has a inverse relationship with downstream blood pressure as well as a direct relationship with upstream blood pressure. Both these relationships are represented by the dashed and solid arrows, respectively.
Vasoconstriction
Peripheral resistance depends on the diameter of the vessel. The insert shows that by increasing vasoconstriction (VCN) vessel diameter is reduced even further thus increasing its peripheral resistance; this direct relationship is indicated by the solid line between the two.
Neural Control
The sympathetic division of the autonomic nervous system exerts generalized control over vessels with smooth muscle cells in their walls. Such nerves are referred to as vasomotor nerves (VM); those that cause these circular muscle cells to contract, narrowing the vessel, are called vasoconstrictor nerves while those that cause the muscle cells to relax -- and allow blood pressure to expand them -- are called vasodilator nerves.
The reason for these different responses has to do with the type of receptor on the encircling smooth muscle cells. Vessels with �stimulatory� alpha 1 receptors respond by constricting, narrowing the vessel, and increasing peripheral resistance. Vessels with �inhibitory� muscarinic 2 receptors 'relax', allowing blood pressure to increase the diameter of the vessel, thus decreasing peripheral resistance. This direct relationship between vasoconstriction (VCN) and peripheral resistance (PR) is indicated by the solid arrow in the insert. This will be described more fully in the 'Vascular Centers' section.
Local Control
The insert shows that vasoconstriction is also dependent on 'local controls' such as the concentration of oxygen (O2) and carbon dioxide (CO2) in the interstitial fluid surrounding them. The insert shows the relationship between oxygen and vasoconstriction is direct (solid arrow) while that between carbon dioxide and vasoconstriction is inverse (dashed arrow). A low concentration of oxygen causes a low degree of vasoconstriction; a low concentration of carbon dioxide causes a high degree of vasoconstriction. These relationships will be described more fully in the next section.
Capillaries
Capillaries have neither elastic fibers nor smooth muscle cells; they consist of a single layer of simple squamous endothelium. They are the sites of diffusion of respiratory gases--among other things-- between the blood and interstitial fluid. Interstitial fluid in active tissues becomes oxygen poor and carbon dioxide rich; the reverse is true of inactive tissues. Also, fluid shifts, due to an interplay between hydrostatic and osmotic pressures, play a major role in water balance.

Precapillary Sphincters
Capillaries are not always open; flow through them is controlled by smooth muscle precapillary sphincters shown as a donut in the insert. The relationship between vasoconstriction and flow is inverse (dashed arrow); an increase in vasoconstriction causes a decrease of flow into the capillary due to constriction of the sphincter. This is represented by the dashed arrow from VCN to the 'flow arrow' beneath the precapillary sphincter (donut).
Vasoconstriction is under the control of carbon dioxide (CO2) and oxygen (O2) in the surrounding interstitial fluid.
Hydrostatic Pressure (HP)
When blood enters capillaries, hydrostatic pressure (HP) forces fluid (HP arrow) into the interstitial space leaving larger plasma proteins (PP) in the vessel. This direct relationship is shown by a solid arrow pointing from the HP block arrow to PP. If hydrostatic pressure was the only force at work, the interstitial fluid would become increasingly dilute while the volume of plasma would decrease and become more concentrated with plasma proteins, etc.
Osmotic Pressure (OP)
If a substance is concentrated in one place it will tend to 'spread out' into adjacent regions where it is less abundant. This is because all molecules are constantly in random motion (kinetic energy). Eventually, the concentration of the substance will be uniform throughout the region -- equilibrium has been reached. Diffusion is occurring while it is still 'spreading out'. Once water molecules are equally distributed diffusion is no longer occurring though molecular motion continues.
Capillary Beds of Active and Inactive Tissues
At any given time some tissues are metabolically active while others are less so. During metabolism oxygen concentration is decreasing while carbon dioxide production is increasing. Accordingly, the interstitial fluid in active tissues is becoming oxygen-poor and richer in carbon dioxide. The concentrations of these two respiratory gasses is what directs blood into areas of metabolically active tissues and reduces flow into inactive areas.
The insert shows blood flowing through an open precapillary sphincter implying the tissue beyond is metabolically active. Since arterial blood is rich in oxygen this gas will diffuse (first D arrow) out into the interstitial fluid where its concentration will increase. Simultaneously, active tissue is rich in carbon dioxide so it will diffuse (second D arrow) into the blood and its interstitial concentration will decrease. As the interstitial concentration of oxygen decreases and that of carbon dioxide increases the precapillary sphincter will vasoconstrict (VCN) and decrease flow into the tissue. In summary, blood flow will increase in metabolically active tissues where oxygen is decreasing and carbon dioxide is increasing at the same time because ...
Osmosis
If the substance under consideration happens to be water it will behave just like any other substance. It will spread out (i.e., diffuse), along its gradient, away from a place where it is highly concentrated into adjacent regions where it is less abundant. This will continue until the concentration of water is uniform throughout the region. Because water is so abundant and its diffusion is so critical to life the diffusion of water is given a special name...osmosis.
The insert shows that blood pressure in porous capillaries forces water out into the interstitial space by hydrostatic pressure (HP) leaving behind large plasma proteins (PP) molecules. These take up space where water molecules used to be thus reducing the 'concentration of water'. A water gradient now exists between these two adjacent fluid compartments and is symbolized by the solid arrow pointing from PP to the OP arrow. The concentration of water is now greater in the interstitial fluid than it is in the capillary. Accordingly, water will diffuse from its high concentration region into its low concentration region. This movement of water back into the capillaries is called osmotic pressure (OP). This return of water prevents a significant decrease in blood volume and in the capillary.
Veins
Veins return blood to the heart. Over the course of a minute this volume is called the venous return (VR). By the time blood leaves capillaries and enters the veins its pressure has been reduced to practically nothing. Additionally, these vessels have relatively thin walls and tend to easily expand making flow even more difficult. Because blood flows along its pressure gradient -- which at this point is very low -- there are several mechanisms to assist it.
Compliance
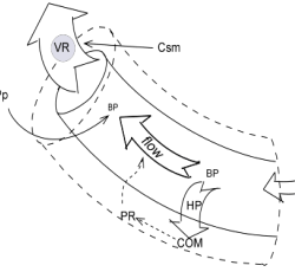
Veins are compliant, that is, they stretch when filling but, unlike elastic arteries, recoil is minimal. In fact, they are so compliant that they normally hold approximately 70% of our blood volume. Compliance (COM) is shown as the dashed outline around the vein. The stretch is caused by the hydrostatic pressure (HP) ( HP arrow) resulting from blood pressure (BP) entering veins.
Compliant vessels (COM) have large diameters which means they exert little peripheral resistance (PR). This inverse relationship is shown by the dashed arrow between these two factors -- the greater the compliance the lower the peripheral resistance. Also, low peripheral resistance is inversely related to flow as indicated by the dashed arrow -- low resistance helps to increase flow and vice versa.
High compliance favors flow by providing little loss of pressure due to friction; the peripheral resistance is small. However, compliance simultaneously does not favor flow because the pressure gradient--flow arrow between the two BP acronyms--is kept small. In other words, since less energy is lost to friction, the pressure at the downstream end of the vessel will not have dropped much meaning the driving force, the pressure gradient, is small.
Mechanisms That Assist Flow in Veins
Valves
Many veins have one way valves that prevent the backflow of blood; a handy mechanism especially in light of the low pressure gradient in veins. These are not shown on the model.
Contractions of Skeletal Muscles
Deep veins pass between skeletal muscles in the extremities. Contraction of these muscles (Csm) presses on the veins causing forward movement of blood through the one way valves. This is shown by the solid arrow (direct relationship) between contraction of skeletal muscles (Csm)) and venous return (VR).
Pleural Pressure
During inhalation, the pressure in the pleural cavities decreases causing the lungs to expand. The veins entering the heart are affected by this pressure drop in the same manner as the lungs; they expand. This pressure drop, due to decreased pleural pressure (Pp) at the end of the great veins, decreases blood pressure (BP) at this location. This direct relationship is shown by the solid arrow between these two factors. The term 'thoracic pump' is often applied to this phenomenon.
Vascular Centers
A chain of neural connections from the carotid sinuses, to the vasodilator centers, to the vasoconstrictor centers, and outward to muscular arteries throughout the body controls the pressure gradient that allows blood to flow. A negative feedback loop between 'downstream' blood pressure in muscular arteries and 'upstream' blood pressure near the heart maintains conditions compatible with life.
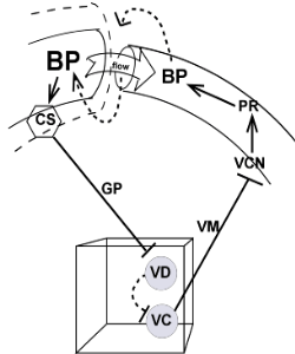
Arterial Blood Pressure
The 'flow arrow' at the top of the insert shows flow from an elastic artery, along a pressure gradient, into a muscular artery. If downstream blood pressure increases too much, regardless of the reason, flow into that vessel will decrease because the pressure gradient has decreased. Then, this decreased flow into the muscular artery will 'back up' blood in the input vessel increasing pressure there ... another inverse relationship.
An increase in blood pressure in the carotid arteries will increase stimulation of the carotid sinuses (CS) as indicated by the solid arrow. Neurons in the sinuses piggyback within the glossopharyngeal nerve (GP) to reach the brainstem. There they increase stimulation of the vasodilator centers (VD) that decrease stimulation of the vasoconstrictor centers (VC) -- an inverse relationship.
Decreased activity from the vasoconstrictor center, via vasomotor nerves (VM) will decrease vasoconstriction(VCN) thus decreasing peripheral resistance (PR) of muscular arteries throughout the body. This will decrease downstream blood pressure leading to a decrease in upstream blood pressure. We have come full circle in this loop that keeps blood pressure from 'going to extremes'.
In summary, increased downstream blood pressure will increase upstream blood pressure. This will stimulate the carotid sinuses to increase the activity of the vasodilator center; this center will, in turn, decrease the activity of the vasoconstrictor center will reduce downstream vasoconstriction causing decrease downstream peripheral resistance that decreases downstream blood pressure. A beautiful negative feedback loop.
Cardiac Centers
The model indicates that the cardioinhibitory (CI) and cardioacceleratory (CA) centers in the medulla of the brainstem are regulated by signals from the carotid sinus (CS) in the aorta as well as from stretch receptors (SR) in the wall of the ventricle. These cardiac centers regulate the heart rate (HR) and force of contraction (C).
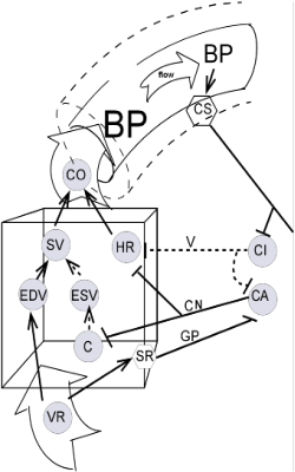
The heart rate is controlled by vagal impulses (V) from the cardioinhibitory center as well as by impulses via cardiac nerves (CN) from the cardioacceleratory center. The force of contraction depends on the contractility of the cardiac muscle cells. Contractility is dependent on impulses from cardiac nerves of the cardioacceleratory center.
Carotid Sinus (CS)
The insert shows there is a direct relationship (solid arrow) between aortic blood pressure (BP) and the carotid sinus (CS). As aortic blood pressure increases so does the activity of the carotid sinus and vice versa.
Brainstem Cardiac Centers
The parasympathetic vagus nerve (V) begins in the cardioinhibitory center (CI) of the brainstem and the sympathetic cardiac nerves (CN) arise from the cardioacceleratory center(AC). Within the brainstem the inverse relationship (dashed line) from the CI to the CA insures increased parasympathetic activity will decrease sympathetic activity.
Cardioinhibitory Center (CI) Targets
The cardioinhibitory center has inverse relationships (dashed lines) with two targets: the pacemaker that controls heart rate (HR) and the nearby cardioacceleratory center (CA).
Cardioacceleratory Center (CA) Targets
The cardioacceleratory center has direct relationships (solid lines) with two targets: the pacemaker that controls heart rate (HR) and the myocardium of the ventricle whose cells contract (C) to eject the blood.
Heart Stretch Receptors
The insert shows a solid arrow (direct relationship) between venous return (VR) and stretch receptors (SR) in the ventricular wall. These receptors send neural impulses to the cardioaccelerator center (CA) via the glossopharyngeal nerve (GP) (solid line; direct relationship). Thus, increased venous return leads to increased activity of the cardioacceleratory center resulting in an increase in heart rate and contractility ... and vice versa.