...and condense it symbolically (right).

When I was a science major in college - and later as a science teacher - I struggled to find a way to master complex information. I was facinated by physiology but overwelmed by numerous names and facts. I tried outlining, making flash cards, rewriting class notes, rewriting the text--- nothing made things stick ---really stick!
I decided I would have to break all this information up into small pieces and then reassemble it in a new way. So, I'd take one "flash card amount" of information, such as...
| 'Heart rate (beats per minute) times stroke volume (volume ejected
each beat) gives you cardiac output (volume ejected per minute.)' ...and condense it symbolically (right). |
 |
| 'If less blood remains in the ventricles after a contraction (end systolic
volume), then more blood was ejected from the heart (stroke volume.)'
...and repeat the procedure (right). |
 |
Now I had two little info bits but they were still isolated
'facts'. However, two things had become apparent: First, the info bits
showed cause-and-effect relationships. The item(s) at the beginning of the arrow 'caused' the item
at the tip of the arrow--- the 'effect.' Second, these two particular info bits shared a common
element--'stroke volume.'  I could conserve space by overlapping this element and show
both relationships simultaneously.
The visual imagery was developing nicely but I had an uneasy feeling about the relationships.
I finally realized that not all cause-and-effect relationships were the same. Most relationships
are direct--if the 'cause' increases then the 'effect' also increases.
However, some relationships are inverse ..if the 'cause' increases
then the 'effect' decreases! It was this realization that lead me to begin to use a
 dashed arrow
to represent an inverse relationship in place of the solid one. The visual image now appeared as seen
at the right.
As I continued studying this topic I learned that:
| '...stimulation by the sympathetic division of the nervous
system causes the heart rate to increase whereas stimulation by the parasympathetic
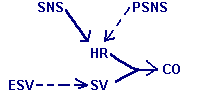
division causes a decrease in heart rate.' I hooked these two facts into the growing map (right). |
 |
As before the new arrows indicated the two types of relationships. However, these
relationships were the results of nerve signals. Signals from the SNS
stimulate heart rate while those from the PSNS inhibit it.
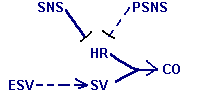
This set of conditions is similar to direct and inverse relationships. I decided to use a
similar symbolism for responses caused by nerve signals; I would use solid and
dashed lines instead of solid and dashed arrows. In place of the arrowhead by the 'effect'
I would use a short vertical line by the 'target.'. This changed the ever-evolving mind map
as shown next.

We tend to interpret direct cause-and-effect relationships by saying... "an increase in the 'cause' leads to an increase in the 'effect'". However, it is equally valid to say... "a decrease in the 'cause' leads to a decrease in the 'effect'". The important point is that any relationship, direct or inverse, can be interpreted in either of two ways. This is also true when considering responses due to nerve stimulation. The following table summarizes these multiple interpretations.
Direct Relationship |
Inverse Relationship | |
|---|---|---|
| An increase in the 'cause' results in an increase in the 'effect.' | An increase in the 'cause' results in a decrease in the 'effect.' | |
| A decrease in the 'cause' results in a decrease in the 'effect.' | A decrease in the 'cause' results in an increase in the 'effect.' |
Stimulatory Nerve |
Inhibitory Nerve |
|---|---|
| An increase in signals causes an increased response in the 'target.' | An increase in signals causes a decreased response in the 'target.' |
| A decrease in signals causes a decreased response in the 'target.' | A decrease in signals causes an increased response in the 'target.' |
... needed to understand and appreciate the information presented in the various physiology flow-diagram models that comprise the remainder of this website. The biggest advantage of flow-diagram models is not in actually having them but rather what you gain in the act of constructing them yourself! It will take many hours and you will find yourself redoing them constantly. But, it is because these hours will be challenging, creative and repetative that the visual image of your model will become implanted in your long-term memory. And, once there, you can call upon it whenever you need the information it contains. Much better than memorization, don't you think?
Last update:7/14/2005