 The graph at the right shows how the charge at the inner surface of the cell membrane relative to the charge at the outer surface
(membrane potential) changes
over time. This pattern is repeated over and over. This cyclical pattern consists of:
The graph at the right shows how the charge at the inner surface of the cell membrane relative to the charge at the outer surface
(membrane potential) changes
over time. This pattern is repeated over and over. This cyclical pattern consists of:
Click here to begin the tutorial.
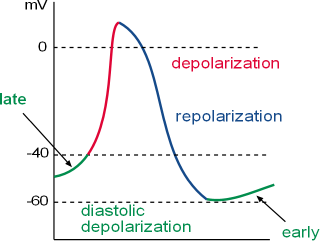
This action potential (AP) graph shows the fluctuations in the membrane potential of the nodal cells of the cardiac pacemaker. These fluctuations occur because of the activities of voltage-gated channels and ion pumps in the cell membrane (called the 'membrane clock') and activities of channels and pumps in the sarcoplasmic reticulum membrane (called the 'calcium clock'). This tutorial describes these activities.
The graph at the right shows how the charge at the inner surface of the cell membrane relative to the charge at the outer surface
(membrane potential) changes
over time. This pattern is repeated over and over. This cyclical pattern consists of:
At 'threshold' calcium channels in the cell membrane open rapidly allowing a large influx of calcium ions. These ions strongly activate sodium calcium exchangers in the cell membrane that rapidly return one calcium ion to the outside in 'exchange' for three sodium ions. This occurs very rapidly causing the sharp upswing in the graph.
In addition to activating the exchangers, the 'external' calcium ions also trigger calcium channels of the sarcoplasmic reticulum to open. These add to the activation of the exchangers. The exchangers cease to function as the membrane potential enters the positive range and calcium ions remaining in the cytoplasm are returned to the sarcoplasmic reticulum.
Membrane calcium channels close very soon after opening while potassium channels are simultaneously opening. As the loss of positive becomes greater than the gain, the curve changes direction and heads downward. As the membrane potential becomes more negative the potassium channels to begin closing. Simultaneously, sodium (pacemaker) channels begin opening causing the steepness of this downward portion of the curve to begin to level out.
As the membrane potential becomes more positive calcium channels open allowing a small influx of ions. These few ions mildly activate sodium calcium exchangers in the cell membrane to remove one calcium ion (Ca2+) from the cell in exchange for three sodium ions (Na+).
Last updated: 2/13/2016
Click here to begin the tutorial.